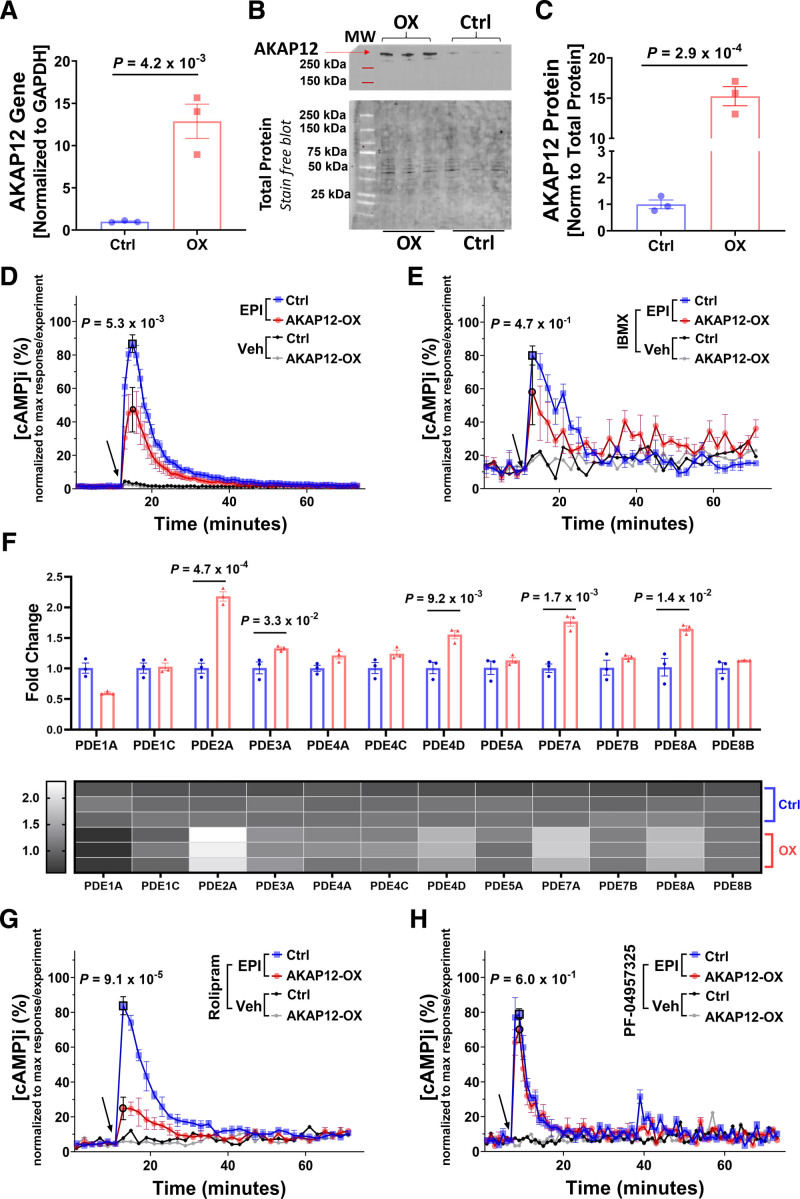
Figure 1.
AKAP12 (A kinase anchoring protein 12) upregulation in vitro reduces intracellular cAMP (cyclic adenosine 3′,5′-monophosphate) levels. A, Quantification of RTqPCR for AKAP12 gene expression in AC16 cells stably transfected with human AKAP12 plasmid (AKAP12-OX) and nontransfected AC16 cells (Ctrl); n=3 in each group. B, Representative Western blot comparing AKAP12 expression in AC16 cells stably transfected with human AKAP12 plasmid (AKAP12-OX) and nontransfected AC16 cells (Ctrl). C, Quantification of AKAP12 protein expression, n=3 in each group. Intracellular cAMP levels in AC16 cells were detected using Glosensor Luciferase assay under different pretreatments followed by 10-µM Epinephrine (EPI); (D) without pre-treatment (E) pretreatment for 30 minutes with 0.1-mM IBMX (G) pretreatment for 30-minute 10-µM Rolipram, or (H) pretreatment for 30-minute 200-nM PF-04957325. F, Quantification of RTqPCR for PDEs (phosphodiesterases) in the AC16 cells. Data represented as % intracellular cAMP (normalized data; data was normalized for each experiment separately using the following equation: x new = ((x-x min)/(x max-x min))*100). The arrow indicates the start of EPI treatment or vehicle (Optimem) addition. All data represented as average mean±SEM; D and E, n=6, (Veh=3 for panel E) G and H; n=3. All experiments were performed as technical duplicates. Data in panels D, E, G and H are independent experiments and normalization of data was performed for each treatment separately. Data were determined to have a parametric distribution by the Shapiro-Wilk test; α=0.05 G. Data in panels A, C and F were analyzed using unpaired 2-tailed student t-test. Data in panels D, E, G and H were analyzed using two-way ANOVA at point of max response followed by Sidak multiple comparisons post hoc test. The point of max response has black borders. Veh indicates vehicle.

