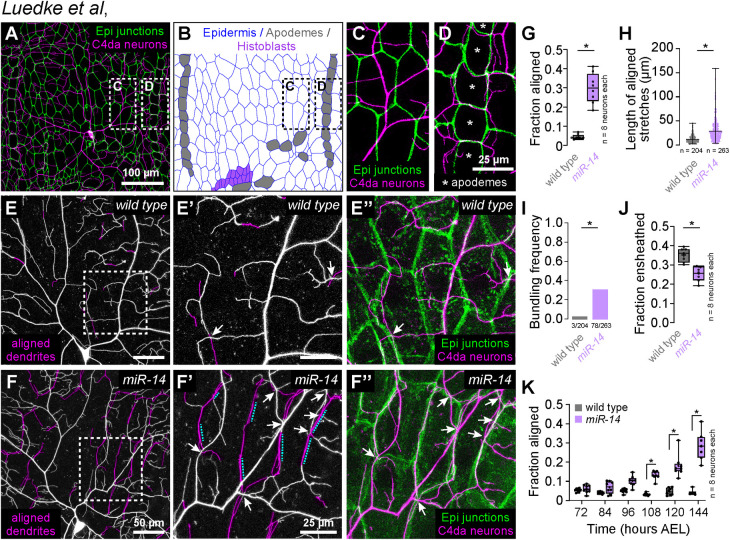
Fig 1. Identification of a genetic program that limits dendrite alignment along epidermal cell-cell junctions.
(A-D) Dual-labeling of epidermal septate junctions (Nrx-IVGFP) and nociceptive C4da neurons (ppk-CD4-tdTomato) in third instar larvae. (A) Maximum projection of a confocal stack showing the distribution of C4da dendrites over epidermal cells in a single dorsal hemisegment. (B) Tracing of epidermal cells depicting distribution of the principal epidermal cell types (epidermal cells, apodemes and histoblasts, pseudocolored as indicated). (C-D) High magnification views of dendrite position over epidermal cells (C) adjacent to posterior segment boundary and (D) dendrite position over apodemes (marked with asterisks) at the posterior segment boundary. Asterisks mark apodemes. (E-I) miR-14 regulates dendrite position over epidermal cells. (E-F) Maximum intensity projections of C4da neurons from (E) wild-type control and (F) miR-14Δ1 mutant larvae at 120 h AEL showing epidermal junction-aligned dendrites pseudocolored in magenta. Insets (E’ and F’) show high magnification views of corresponding regions from control and miR-14Δ1 mutants containing junction-aligned dendrites. Arrows mark dendrite crossing events involving junction-aligned dendrites and dashed lines mark aligned dendrites that are bundled. (E” and F”) Maximum intensity projections show relative positions of C4da neurons (ppk-CD4-tdTomato) and epidermal junctions labeled by the PIP2 marker PLCδ-PH-GFP. (G-K) Quantification of epidermal dendrite alignment phenotypes. Plots depict (G) the fraction of C4da dendrite arbors that are aligned along epidermal junctions at 120 h AEL, (H) the length of aligned stretches of C4da dendrites, (I) the proportion of terminal dendrites that were present in bundles, (J) the proportion of C4da dendrites ensheathed by epidermal cells at 120 h AEL, and (I) the proportion of C4da dendrite arbors that aligned along epidermal junctions over a developmental time course in control and miR-14Δ1 mutant larvae. Box plots here and in subsequent panels depict mean values and 1st/3rd quartile, whiskers mark 1.5x IQR, and individual data points are shown. *P<0.05 compared to pre-EMS control; Mann Whitney test (G-H), Fisher’s exact test (I), unpaired t-test with Welch’s correction (J) or Kruskal-Wallis test with post-hoc BH correction (K).. Sample sizes are indicated in each panel.

