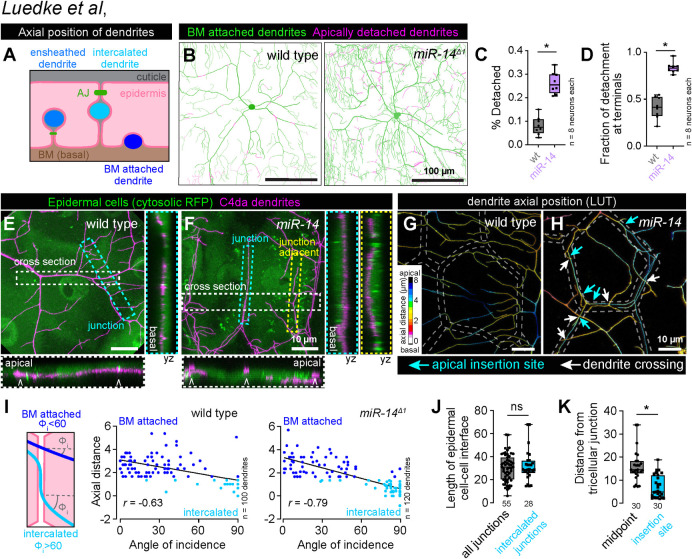
Fig 3. Junctional-aligned dendrites intercalate between epidermal cells.
(A) Schematic illustrating the axial position of ensheathed, epidermal junction aligned (intercalated) and BM-attached dendrites. (B) Apical dendrite detachment from the BM. Traces depict BM-contacting dendrites in green and BM-detached dendrites in magenta for representative wild-type control and miR-14 mutant C4da neurons. Plots depict (C) the fraction of C4da dendrites apically detached from the BM and (D) the fraction of apical detachment that involves terminal dendrites. *P<0.05 compared to wild-type control, unpaired t-test with Welch’s correction. (E-H) Junction-aligned dendrites apically intercalate between epidermal cells. Maximum intensity projections show distribution of C4da dendrites over individual epidermal cells in wild-type control (E) and miR-14 mutant larvae (F). Orthogonal sections span the width of epidermal cells (cross section; carets mark position of epidermal junctions), the epidermal cell-cell interface (junction section, marked by cyan hatched box) and run adjacent to the epidermal cell-cell interface (junction adjacent section, marked by yellow hatched box). Among these, only junction-aligned dendrites penetrate to the apical surface of epidermal cells. (G-H) Z-projections of confocal stacks depicting axial dendrite position according to a lookup table in wild-type control (G) and miR-14 mutant larvae. White hatched lines outline epidermal junctions, white arrows depict dendrite crossing events involving junction-aligned dendrites, cyan arrows depict apical insertion site of junction-aligned dendrites (I) Schematic depicting approach to measuring dendrite-epidermal junction angles of incidence (left) and scatterplots of axial distance (dendrite to epidermal AJ) versus dendrite-junction angle of incidence (right). Note the inverse linear regression (black lines). (J) Dendrite intercalation is distributed across a range of epidermal cell sizes but preferentially occurs near tricellular junctions. The plot depicts the distribution of edge lengths at epidermal cell-cell interfaces (all junctions, gray) and the length distribution of all epidermal cell-cell interfaces that contain intercalated dendrites (intercalated junctions, cyan). (K) The insertion site for epidermal intercalation is biased towards tricellular junctions. The plot depicts the length from the midpoint of the cell-cell interface to a tri-cellular junction (midpoint) and the distance between the site of apical dendrite intercalation from the nearest tricellular epidermal junction. Measurements were taken from 30 epidermal cell-cell interfaces in miR-14 mutant larvae that contained a single intercalated dendrite. *P<0.05, ns, not significant (P>0.05) compared to wild-type control, Wilcoxon rank sum test.

