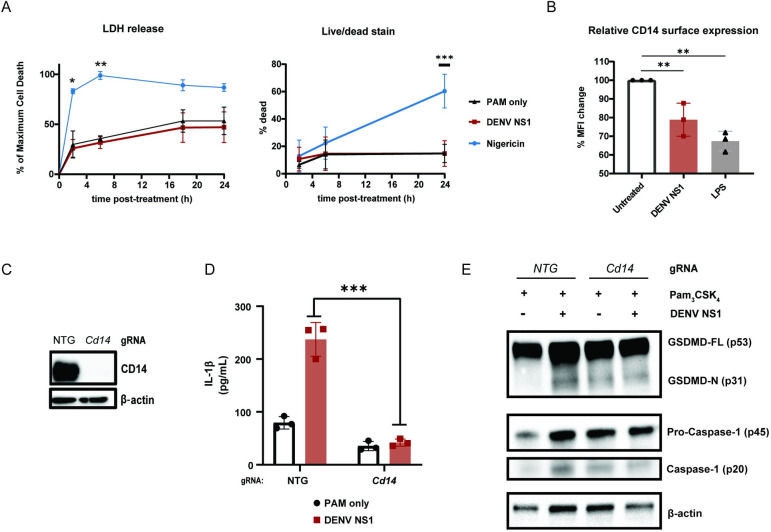
Fig 3. DENV NS1 induces inflammasome activation in macrophages in a CD14-dependent manner without inducing cell death.
(A) BMDMs were primed with PAM3CSK4 (1μg/mL) for 17h and then treated with DENV2 NS1 (10μg/mL), nigericin (5μM), or medium (PAM only). At the indicated timepoints, supernatants were assessed for lactase dehydrogenase (LDH) levels as a proxy for cell death. LDH levels were calculated as a percentage of maximum LDH release. (left panel) Cells were also stained using a LIVE/DEAD Fixable Far Red stain and analyzed by flow cytometry. (right panel) Statistical significance was determined using two-way ANOVA with Dunnett’s multiple comparisons test. (B) BMDMs were primed with PAM3CSK4 (1μg/mL) for 17h and then treated with DENV2 NS1 (10μg/mL), LPS (5μg/mL) or no treatment (Untreated). After 30 min, cells were stained for surface CD14 expression and analyzed by flow cytometry. Data are normalized as a percentage of the median fluorescence intensity of the treatment groups divided by the untreated control. Statistical significance was determined using one-way ANOVA with Holm-Sidak’s multiple comparisons test. (C) Representative Western blots of cell lysates from BMDMs nucleofected with either NTG or CD14 Cas9-gRNA ribonuclear protein complexes. (D) BMDMs from (C) were primed with PAM3CSK4 (1μg/mL) for 17h and treated with DENV2 NS1 (10μg/mL) or no treatment for 48h. IL-1β levels in supernatant were measured by ELISA (E). Lysates from cells 24 hours post-treatment were evaluated by Western Blot. Statistical significance was determined using two-way ANOVA with Holm-Sidak’s multiple comparisons test. The data are shown as the mean ± SD of 3 biological replicates (A,B,D), or a representative image taken from 2 biological replicates (C,E). *p<0.05, **p<0.01, *** p< 0.001.

