. 2024 May 7;12:RP88991. doi: 10.7554/eLife.88991

Figure 1. Phosphoinositide 3-kinase beta (PI3Kβ) prioritizes membrane interactions with receptor tyrosine kinase (RTK)-derived phosphorylated (pY) peptides over Rac1(GTP) and G-protein complexes (GβGγ).

(A) Cartoon schematic showing membrane-tethered signaling inputs (i.e. pY, Rac1(GTP), and GβGγ) attached to a supported lipid bilayer and visualized by TIRF-M. Heterodimeric Dy647-PI3Kβ (p110β-p85α) in solution can dynamically associate with membrane-bound proteins. (B) Cartoon schematic showing method for visualizing membrane-tethered signaling inputs. (C) Kinetics of Rac1 nucleotide exchange measured in the presence of 20 nM Rac1(GTP) sensor (Cy3-p67/phox) and 50 nM P-Rex1 (DH-PH domain). (D) Visualization of membrane conjugated RTK derived pY peptide (~6000 /µm2), Rac1(GTP) (~4000 /µm2), and GβGγ (~4800 /µm2) by TIRF-M. Representative TIRF-M images showing the membrane localization of 20 nM nSH2-Cy3 in the absence and presence of membranes conjugated with a solution concentration of 10 µM pY peptide. Representative images showing the membrane localization of 20 nM Cy3-p67/phox Rac1(GTP) sensor before (GDP) and after (GTP) the addition of the guanine nucleotide exchange factor, P-Rex1. Equilibrium localization of 50 nM (low) or 200 nM (high) farnesyl GβGγ-SNAP-AF488. (E) Representative TIRF-M images showing the equilibrium membrane localization of 10 nM Dy647-PI3Kγ measured in the absence and presence of membranes equilibrated with 200 nM farnesyl GβGγ. (F) Representative TIRF-M images showing the equilibrium membrane localization of 5 pM and 10 nM Dy647-PI3Kβ measured in the presence of membranes containing either pY, Rac1(GTP), or GβGγ. The inset image (+GβGγ) shows low-frequency single molecule binding events detected in the presence of 10 nM Dy647-PI3Kβ. Note that the contrast of the inset image was scaled differently to show the rare Dy647-PI3Kβ membrane binding events. (G) Bulk membrane absorption kinetics for 10 nM Dy647-PI3Kβ measured on membranes containing eitherpY, Rac1(GTP), or GβGγ. Membrane composition: 96% DOPC, 2% PI(4,5)P2, 2% MCC-PE.

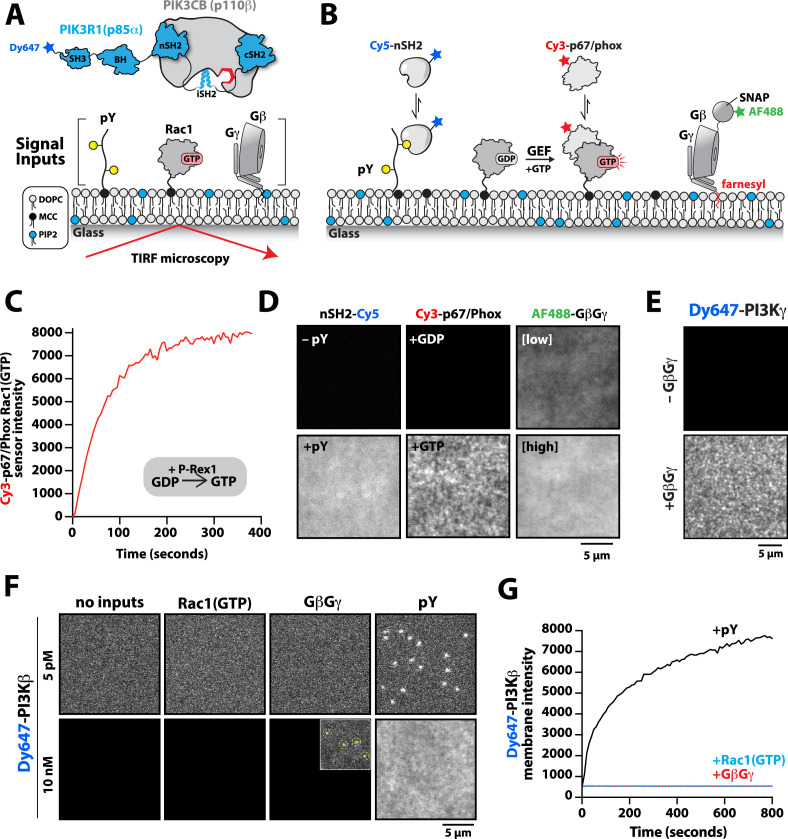
Figure 1—source data 1. Related to Figure 1C.
Figure 1—source data 2. Related to .Figure 1G.

Figure 1.

Figure 1—figure supplement 1. Characterization of Alexa488-SNAP-GβGγ localization on supported lipid bilayers.

Figure 1—figure supplement 1.

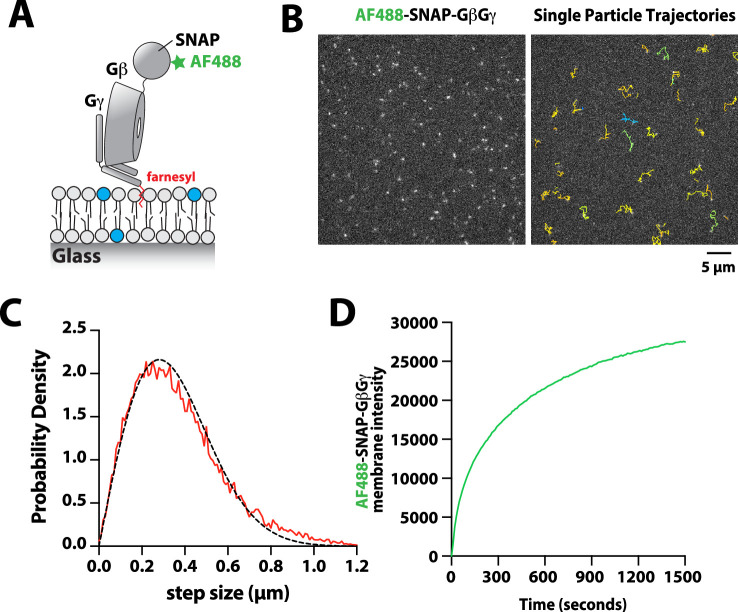
(A) Cartoon showing the structural organization of the farnesylatedGβGγ complex inserted into a supported lipid bilayer. The complex was labeled using Alexa488-SNAP surface dye, which we conjugated to the SNAP-tag fused to the N-terminus of the Gβ subunit. (B) Representative TIRF-M images showing the localization of Alexa488-SNAP-GβGγ on supported lipid bilayer. The ImageJ TrackMate single molecule tracking plugin was used to identify and track Alexa488-SNAP-GβGγ molecules.(C) Step size distribution showing single molecule displacements of n=1128 Alexa488-SNAP-GβGγ particles (n=23,083 steps, D=1.79 µm2/s).(D) Bulk membrane absorption kinetics of 200 nMfarnesyl GβGγ (10% Alexa 488-SNAP-GβGγ). (C–D) Membrane composition: 98% DOPC, 2% PI(4,5)P2.
Figure 1—figure supplement 1—source data 1. Related to Figure 1—figure supplement 1B.
Figure 1—figure supplement 1—source data 2. Related to Figure 1—figure supplement 1C.
Figure 1—figure supplement 2. Characterization of Dy647-PI3Kβ membrane association with individual signaling inputs.

Figure 1—figure supplement 2.

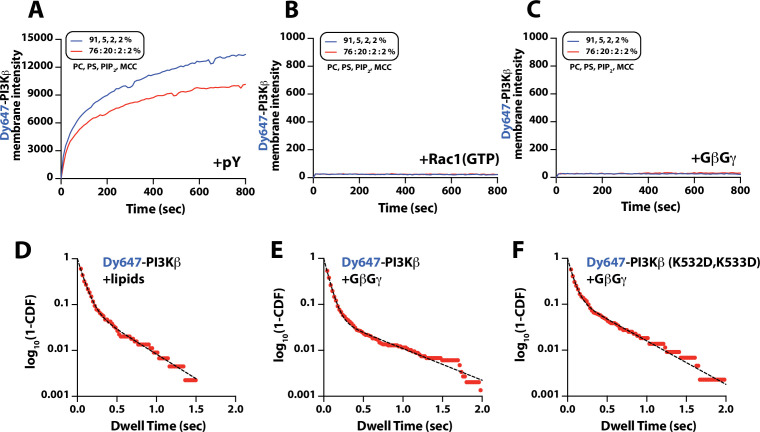
(A–C) Kinetic traces showing the bulk membrane localization of 10 nM Dy647-PI3Kβ measured of supported lipid bilayers (SLBs) with either (A) phosphorylated (pY), (B) Rac1(GTP), or (C) G-protein complexes (GβGγ) tethered to the membrane. The following concentrations of protein were used for membrane coupling or passive membrane absorption: (A) 10 µM pY, (B) 30 µM Rac1(GTP), or (C) 200 nMGβGγ.(A–C) Membrane lipid composition: 91% DOPC, 5% DOPS, 2% PI(4,5)P2, 2% MCC-PE (blue line); 76% DOPC, 20% DOPS, 2% PI(4,5)P2, 2% MCC-PE (red line). Note that the coupling efficiency of pY is generally reduced by high concentrations of anionic lipids, presumably due to electrostatic repulsion. (D–F) Single molecule dwell time distributions measured in the presence of (D) 10 nM Dy647-PI3Kβ+lipids (τ1=71 ± 1 ms, τ2=319 ± 123 ms, α=0.89, n=1821 particles) (E) 10 nM Dy647-PI3Kβ+200 nM GβGγ (τ1=63 ± 1 ms, τ2=602 ± 39 ms, α=0.94, n=5992 particles), or (F) 10 nM Dy647-PI3Kβ GβGγ mutant (K532D/K533D)+200 nM GβGγ (τ1=60 ± 3 ms, τ2=494 ± 49 ms, α=0.87, n=2157 particles). Data plotted as log10(1–CDF) (cumulative distribution frequency). Dwell time statistics represent the average of n=2 technical replicates. Alpha(α) represents the fraction of particles characterized by the time constant (τ1). Only particles tracked for at least two frames (44 ms) were included in the distributions. Note that a 2000-fold higher concentration of Dy647-PI3Kβ is needed to observe single molecule binding events under these conditions compared to membrane containing membrane-anchored pY peptide. (D–F) Membrane composition: 78% DOPC, 20% DOPS, 2% PI(4,5)P2.
Figure 1—figure supplement 2—source data 1. Related to Figure 1—figure supplement 2A.
Figure 1—figure supplement 2—source data 2. Related to .Figure 1—figure supplement 2B.
Figure 1—figure supplement 2—source data 3. Related to Figure 1—figure supplement 2C.
Figure 1—figure supplement 2—source data 4. Related to .Figure 1—figure supplement 2D.
Figure 1—figure supplement 2—source data 5. Related to .Figure 1—figure supplement 2E.
Figure 1—figure supplement 2—source data 6. Related to .Figure 1—figure supplement 2F.