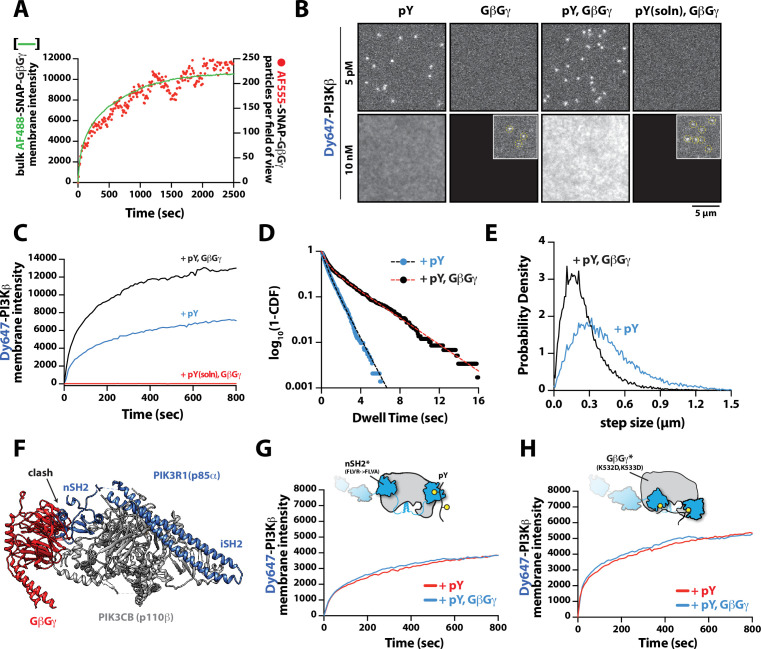
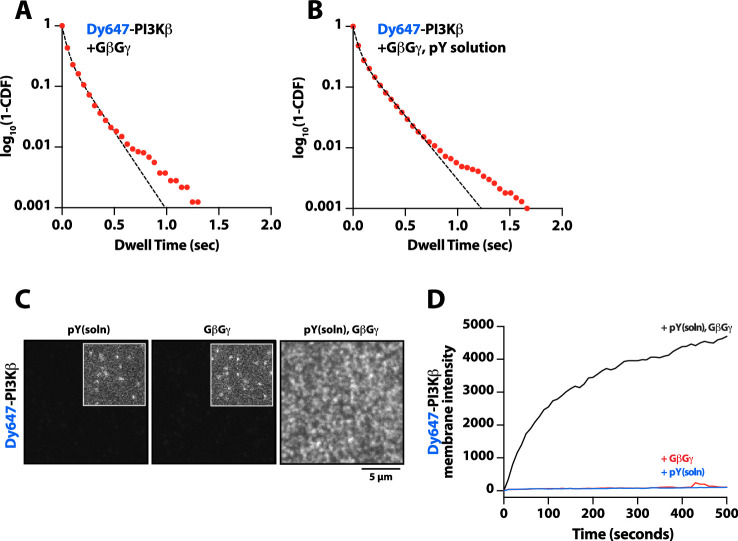
Figure 3. Mechanism controlling synergistic Dy647-PI3Kβ membrane binding by phosphorylated (pY) and G-protein complexes (GβGγ).
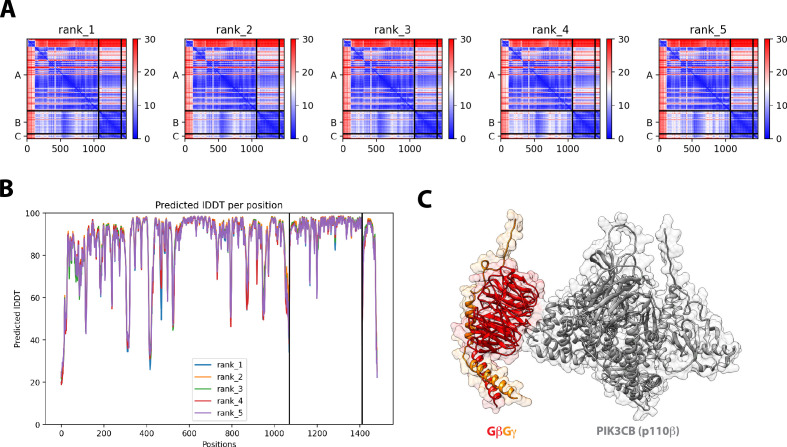
(A) Kinetic trace showing the membrane absorption of 200 nM AF488-SNAP-GβGγ containing 0.0025% AF555-SNAP-GβGγ measured by TIRF-M. Single molecule densities of AF555-SNAP-GβGγ were calculated for each frame in a field of view of 3000 µm2. (B) Representative TIRF-M images showing the equilibrium membrane localization of 5 pM and 10 nM Dy647-PI3Kβ on membranes containing either pY, GβGγ, pY/GβGγ, or pY(solution)/GβGγ. The inset image (+GβGγ and +pY/GβGγ) shows low-frequency single molecule binding events detected in the presence of 10 nM Dy647-PI3Kβ. Supported membranes were conjugated with 10 µM pY peptide (final surface density of ~15,000 pY/µm2) and equilibrated with 200 nM farnesyl-GβGγ before adding Dy647-PI3Kβ. pY (solution)=10 µM. (C) Bulk membrane recruitment dynamics of 10 nM Dy647-PI3Kβ measured in the presence of either pY alone, pY/GβGγ, or pY (solution)/GβGγ. pY(solution)=10 µM. (D) Single molecule dwell time distributions measured in the presence of 5 pM Dy647-PI3Kβ on supported membranes containing pY alone (τ1=0.55 ± 0.11 s, τ2=1.44 ± 0.56 s, α=0.54, n=4698 particles, n=5 technical replicates) or pY/GβGγ (τ1=0.61 ± 0.13 s, τ2=3.09 ± 0.27 s, α=0.58, n=3421 particles, n=4 technical replicates). Alpha(α) represents the fraction of particles characterized by the time constant (τ1). (E) Step size distributions showing single molecule displacements measured in the presence of either pY alone (D1=0.34 ± 0.04 µm2/s, D2=1.02 ± 0.07 µm2/s, α=0.45) or pY/GβGγ (D1=0.23 ± 0.03 µm2/s, D2=0.88 ± 0.08 µm2/s,α=0.6); n=3-4 technical replicates from >3000 tracked particles with 10,000-30,000 total displacements measured. Alpha(α) represents the fraction of particles characterized by the diffusion coefficient (D1). (F) Combined model of the putative nSH2 and GβGγ binding sites on p110β. The p110β-GβGγ binding site is based on an Alphafold multimer model supported by previous HDX-MS and mutagenesis experiments. The orientation of the nSH2 is based on previous X-ray crystallographic data on PI3Kα (p110α-p85α, niSH2, PDB:3HHM) aligned to the structure of PI3Kβ (p110β-p85α, icSH2, PDB:2Y3A). (G) Bulk membrane recruitment dynamics of 10 nM Dy647-PI3Kβ, WT and nSH2(R358A), measured on membranes containing either pY or pY/GβGγ. (H) Bulk membrane recruitment dynamics of 10 nM Dy647-PI3Kβ, WT and GβGγ binding mutant, measured on membranes containing either pY or pY/GβGγ. (A–H) Membrane composition: 96% DOPC, 2% PI(4,5)P2, 2% MCC-PE.


