. 2024 May 7;12:RP88991. doi: 10.7554/eLife.88991

Figure 5. G-protein complexes (GβGγ) and Rac1(GTP) stimulate phosphoinositide 3-kinase beta (PI3Kβ) activity beyond enhancing localization on phosphorylated (pY) membranes.

(A) Representative TIRF-M images showing localization of 20 nM Btk-SNAP-AF488 on supported lipid bilayers (SLBs) containing either 2% PI(4,5)P2 or 2% PI(3,4,5)P3, plus 98% DOPC. (B) Bulk membrane recruitment kinetics of 20 nM Btk-SNAP-AF488 on an SLB measured by TIRF-M. (C–D) Kinetics of PI(3,4,5)P3 production measured in the presence of 10 nM Dy647-PI3Kβ and 1 mM ATP on SLBs with membrane anchored pY, Rac1(GTP), or GβGγ alone. Reactions in (C) were performed in the absence of PS lipids, while membranes in (D) contained 20% DOPS. (E) Cartoon schematic illustrating method for measuring Dy647-PI3Kβ activity in the presence of either pY/Rac1(GDP) or pY/Rac1(GTP). Phase 1 of the reconstitution involves membrane equilibration of Dy647-PI3Kβ in the absence of ATP. During phase 2, 1 mM ATP was added to stimulate lipid kinase activity of Dy647-PI3Kβ. (F) Dual color TIRF-M imaging showing 2 nM Dy647-PI3Kβ localization and catalysis measured in the presence of 20 nM Btk-SNAP-AF488. Dashed line represents the addition of 1 mM ATP to the reaction chamber. (G) Cartoon schematic showing experimental design for measuring synergistic binding and activation of Dy647-PI3Kβ in the presence of pY and GβGγ. (H) Representative single molecule TIRF-M images showing the localization of 20 pM Dy647-PI3Kβ in (G). (I) Kinetics of PI(3,4,5)P3 production monitored in the presence of 20 nM Btk-SNAP-AF488 and 10-20 pM Dy647-PI3Kβ. Membrane contained either pY or pY/GβGγ. (B, C, F, H, I) Membrane composition: 96% DOPC, 2% PI(4,5)P2, 2% MCC-PE. (D) Membrane composition: 76% DOPC, 20% DOPS, 2% PI(4,5)P2, 2% MCC-PE. All kinetic measurements of PI(3,4,5)P3 production were performed in the presence of 20 nM Btk-SNAP-AF488.

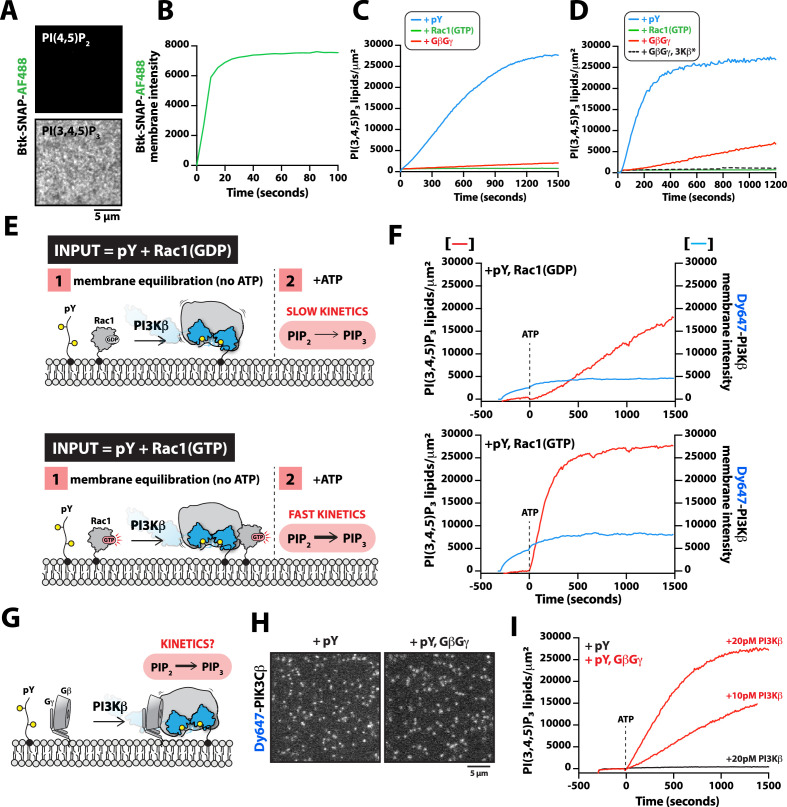
Figure 5—source data 1. Related to Figure 5B.
Figure 5—source data 2. Related to Figure 5C.
Figure 5—source data 3. Related to Figure 5D.
Figure 5—source data 4. Related to Figure 5F.
Figure 5—source data 5. Related to Figure 5I.

Figure 5.

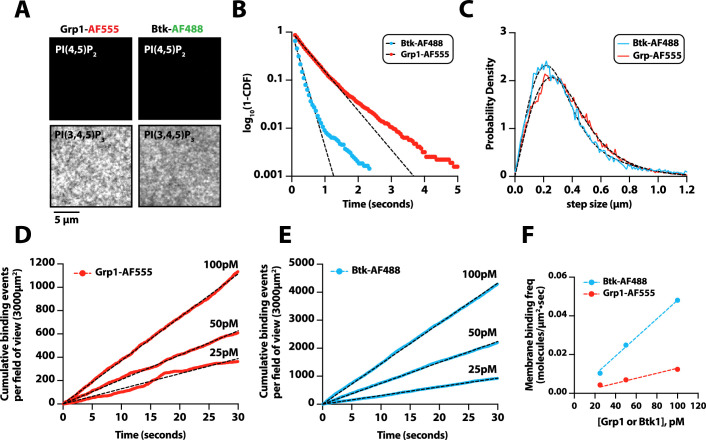
Figure 5—figure supplement 1. Characterization of Bruton’s tyrosine kinase (Btk) and Grp1 membrane binding.

Figure 5—figure supplement 1.

(A) Representative TIRF-M images showing the localization of 50 nM Grp1-AF555 and 50 nM Btk-SNAP-AF488 on supported lipid bilayers containing either 2% PI(4,5)P2 or 2% PI(3,4,5)P3, plus 98% DOPC. (B) Single molecule dwell time distributions measured in the presence of 25 pM Btk-SNAP-AF488 (τ1=183 ms, n=4865 particles) or 50 pM Grp1-AF555 (τ1=523 ms, n=3160 particles). Dwell time distributions were fit to single exponential decay curves to calculate the characteristic dwell times (τ1). (C) Representative step-size distributions fit to a two species model for diffusion (dashed black line). Diffusivity was measured in the presence of either 25 pM Btk-SNAP-AF488 (D1=0.41 µm2/s, D2=1.64 µm2/s,α=0.66, n=4865 particles, n=25,857 steps) or 50 pM Grp1-AF555 (D1=0.53 µm2/s, D2=1.48 µm2/s, α=0.6, n=3160 particles, n=34,549 steps). (D–E) Cumulative membrane of binding events measured in the presence of 25 pM, 50 pM, and 100 pM (D) Grp1-AF555 or (E) Btk-SNAP-AF488. The field of view for the data collected in (D–E) equals 3000 µm2.(F) Calculation of the on-rate (KON) for PI(3,4,5)P3 biosensors for data in (D-E). The slopes from each cumulative membrane binding curve in (D–E) were then plotted as a function of the Grp1-AF555 and Btk-SNAP-AF488 solution concentration to calculate the following association rate constants: KON(Grp1-AF555)=0.13 Grp1 nM–1×µm–2×s–1; KON(Btk-SNAP-AF488) = 0.48 molecules nM–1×µm–2×s–1. Membrane composition for single molecule measurements: 98% DOPC, 2% PI(3,4,5)P3.
Figure 5—figure supplement 1—source data 1. Related to Figure 5—figure supplement 1B.
Figure 5—figure supplement 1—source data 2. Related to Figure 5—figure supplement 1C.
Figure 5—figure supplement 1—source data 3. Related to Figure 5—figure supplement 1D.
Figure 5—figure supplement 1—source data 4. Related to Figure 5—figure supplement 1E.
Figure 5—figure supplement 1—source data 5. Related to Figure 5—figure supplement 1F.
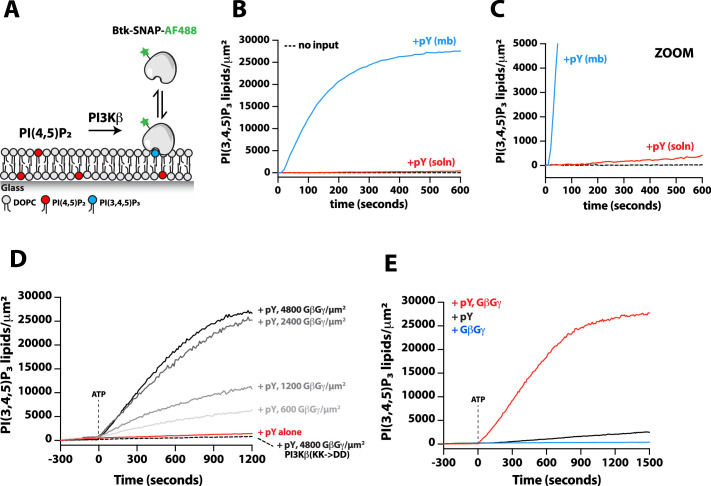
Figure 5—figure supplement 2. Reconstitution of Phosphoinositide 3-kinase beta (PI3Kβ) lipid kinase activity on supported membranes.

Figure 5—figure supplement 2.

(A) Cartoon schematic showing how the production of PI(3,4,5)P3 is monitored by visualizing membrane recruitment of soluble Btk-SNAP-AF488. (B) Kinetics of PI(3,4,5)P3 production monitored in the presence of 20 nM Btk-SNAP-AF488 and 10 nM Dy647-PI3Kβ (note that this PI3Kβ concentration is higher than what was used to measure synergistic activation in Figure 5). Membranes were conjugated with 10 µM pY for 2 hrs (‘pY mb’) or 10 µM pY was added in solution to stimulate Dy647-PI3Kβ. (C) Zoom in on the graph in (B). In the presence of 10 nM Dy647-PI3Kβ, the initial reaction velocities were 157 PI(3,4,5)P3/µm2×s (+pY mb) and 0.76 PI(3,4,5)P3/µm2×s (+pY solution). Membrane composition: 96% DOPC, 2% PI(4,5)P2, 2% MCC-PE.(D) Kinetics of PI(3,4,5)P3 production monitored in the presence of 20 nM Btk-SNAP-AF488, 20 pM Dy647-PI3Kβ, and the indicated densities of SNAP-GβGγ. Membranes contained either pY alone or pY/GβGγ. As a negative control, we measured the activity of the Dy647-PI3Kβ GβGγ binding mutant (K532D, K533D). Membrane composition: 96% DOPC, 2% PI(4,5)P2, 2% MCC-PE. (E) Kinetics of PI(3,4,5)P3 production monitored in the presence of 20 nM Btk-SNAP-AF488 and 20 pM Dy647-PI3Kβ. Membrane contained either pY alone, GβGγ alone, or pY/GβGγ. Membrane composition: 76% DOPC, 20% DOPS, 2% PI(4,5)P2, 2% MCC-PE. (D–E) A final ATP concentration of 1 mM was spiked into the reaction chamber at time zero to initiate the Dy647-PI3Kβ kinase activity measurements.
Figure 5—figure supplement 2—source data 1. Related to .Figure 5—figure supplement 2B.
Figure 5—figure supplement 2—source data 2. Related to Figure 5—figure supplement 2A.
Figure 5—figure supplement 2—source data 3. Related to Figure 5—figure supplement 2B.