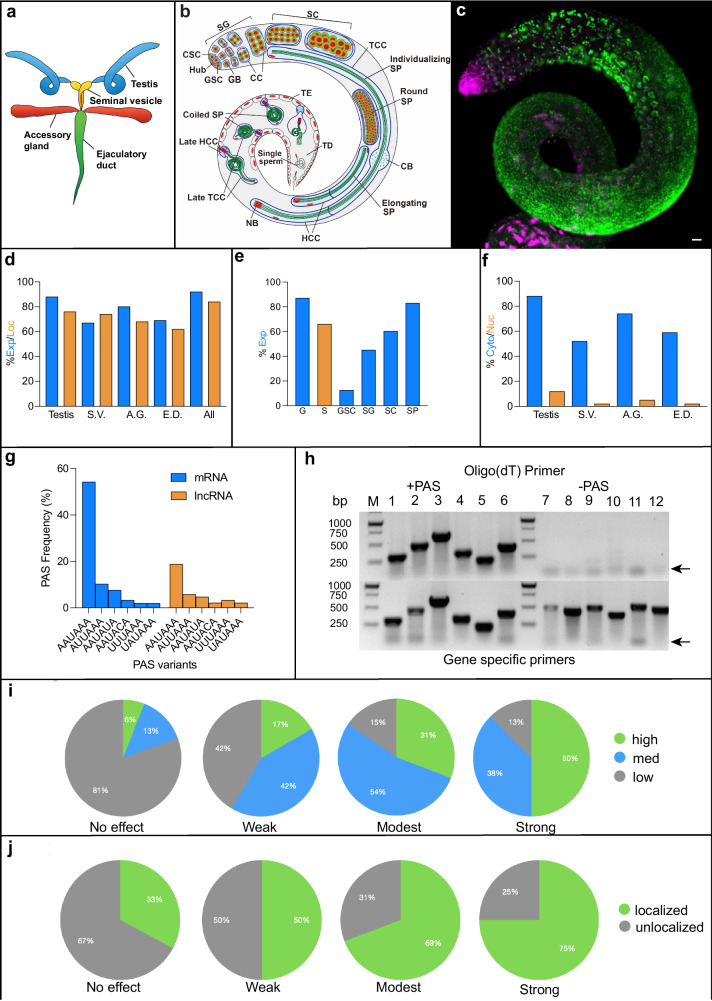
Fig. 1. Male reproductive tissues and lncRNA metrics.
a Schematic of reproductive tissues. b Schematic diagram of testis. Spermatogenesis begins at top left with the stems cells and ends where mature sperm exit the terminal duct (TD). CSC cyst stem cell, GSC germline stem cell, SG spermatogonium, SC spermatocyte, SP spermatid, CB cystic bulge, TCC tail cyst cell, HCC head cyst cell, GB gonialblast, NB nuclear bundle, TE terminal epithelium. c Example of testis expression of lncRNA CR44792. RNA is green, DAPI is magenta. Scale bar = 20 µm. d Percentages of tested lncRNAs expressed (blue) and subcellularly localized (orange) in each of the four assessed tissues. e Percentages of lncRNAs expressed in germline cells (G: blue) and somatic cells (S: orange). Abbreviations are as described in (b). f Percentages of lncRNAs found in the cytoplasm (blue) or nucleus (orange). S.V. seminal vesicle, A.G. accessory gland, E.D. ejaculatory duct. g Percentages of mRNAs (blue) and lncRNAs (orange) with indicated polyadenylation signals (PAS). When multiple PAS signals were detected, only the closest to consensus was counted. Frequencies showing additional PAS motifs and downstream sequence elements are shown in Supplemental Fig. 1. h RT-PCR results for lncRNAs containing ( + PAS) or missing (-PAS) PAS motifs. Genes in the top panels used 3’ end oligo dT primers while those on the bottom used gene-specific 3’ end primers. Arrows indicate non-specific primer-dimer products. lncRNA gene identities (1–12), 3’ end sequences and reverse primers are provided in Supplemental Table 1. i Correlations between relative levels of testis lncRNA expression (based on exposure time) and requirements for fertility23,62. Fertility effects were divided into four groups: unaffected, weakly affected, moderately affected and strongly affected. Expression levels were divided into three groups, low (gray), medium (blue) and high (green). j Correlations between lncRNA subcellular localization in testes and effects on fertility (as defined in panel i). Relative percentages of non-localized (gray) or subcellularly localized (green) lncRNAs for each fertility group. Original images and numbers are available in the provided source data.

