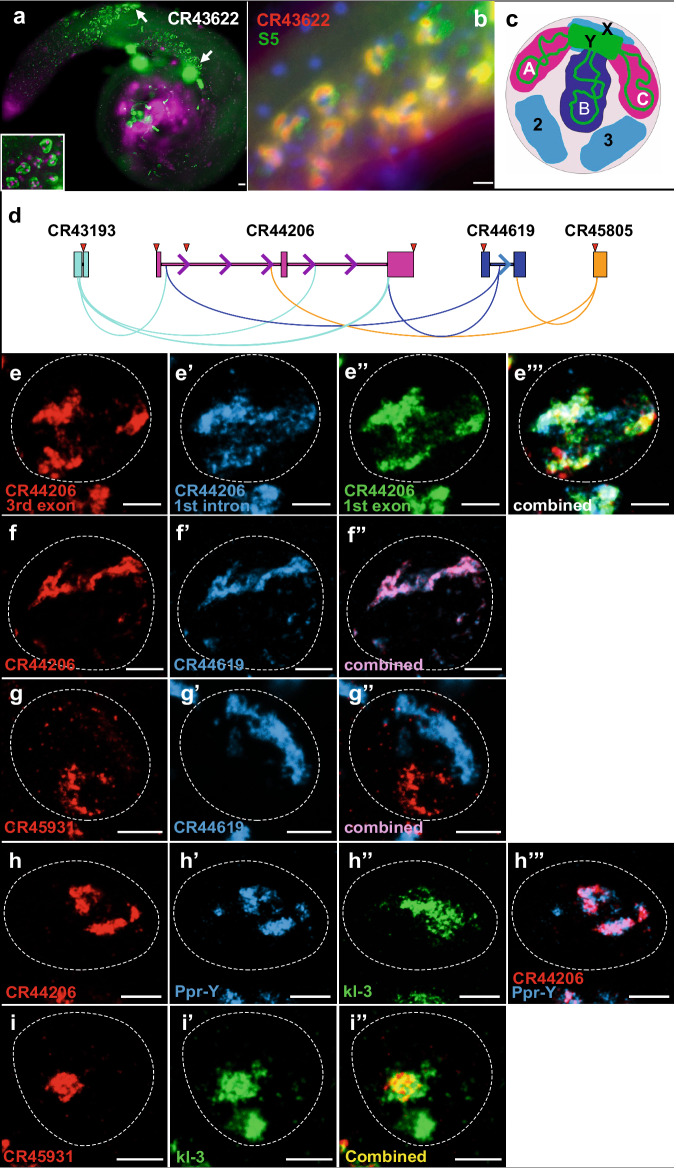
Fig. 2. LncRNA expression in Y-loops.
a Typical ‘Y-loop’ expression of CR43622 (green) in spermatocyte nuclei (magenta). b Co-localization of CR43622 (red) with the Y-loop-associated S5 protein (green). DAPI is blue. a, b Scale bars = 20 μm. c Schematic of a late spermatocyte nucleus (adapted from25) indicating approximate locations of chromosomes X, Y, 2, and 3. Relative positions of the A, B, and C loops produced by Y mega-genes kl-5, kl-3, and ks-1/ORY (green lines) and their transcripts (pink and dark blue shading). d Diagram of Y-loop lncRNA CR44206 and three predicted lncRNA interactors. Exons (thick rectangles), introns (thin lines), transcription direction (arrows), probe-target sites (triangles). Complementary sites are illustrated with curved lines connecting complementary pairs. e–i HCR FISH using oligonucleotide probes that specifically target e CR44206 3rd exon (e), 1st intron (e'), 1st exon (e'') and combined (e'') in a single primary spermatocyte nucleus, f CR44206 and predicted interactor CR44619, g CR44619 and predicted non-interactor CR45931, h CR44206 and two mega-gene transcripts, Ppr-Y and kl-3 or i CR45931 and the mega-gene kl-3. Individual spermatocyte nuclei are outlined in white dashed circles. e–i Scale bars = 5 µm. Images are projected confocal stacks with Z-step size 0.07 µm × 50 slices.

