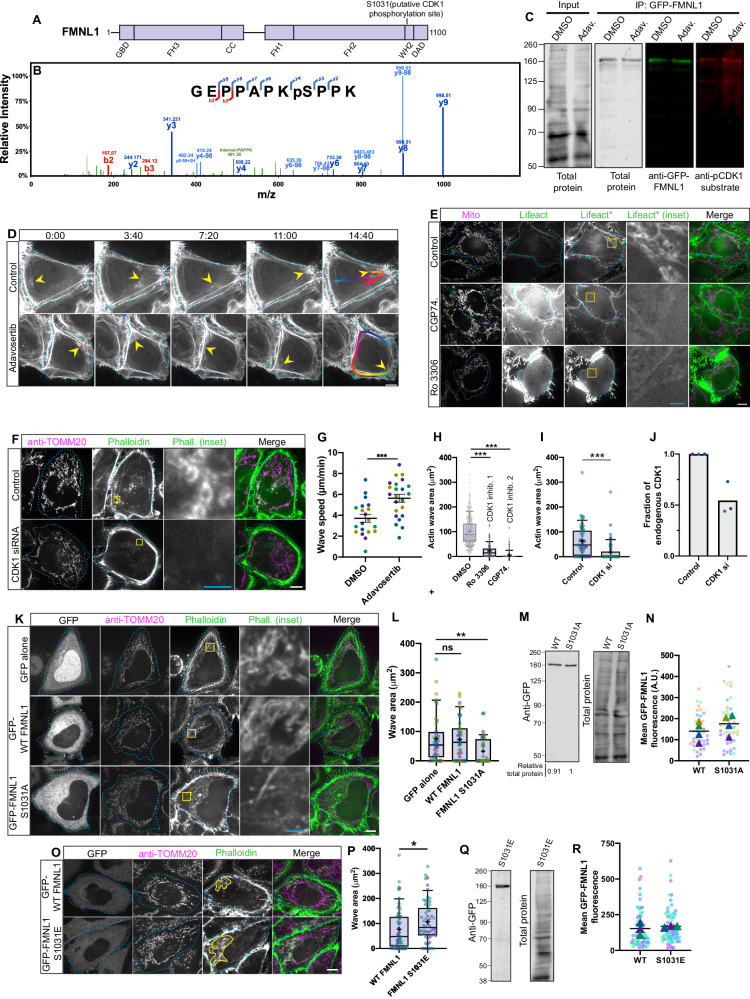
Fig. 2. CDK1 positively regulates the actin wave via FMNL1.
A FMNL1 schematic (B) MSMS scan of residues 1024–1034 (1 experiment). C Representative GFP-FMNL1 IP from cells treated with vehicle ( ~ 2 h DMSO) or adavosertib ( ~ 6.5 h 300 nM). Probed with anti-GFP and anti-phoso-CDK1 substrate sequence. Repeated 3X. D Effects of ~4 h adavosertib at 300 nM on wave. Unequal contrasting between groups for ease of viewing. E Effects of CDK1 inhibitors on wave. Asterisk denotes contrast adjustment between conditions, performed as acquisition parameters varied throughout experiment. F CDK1 siRNA treatment. G Effects of adavosertib on wave speed; bars represent means with SEM. Two-sided Student’s t-test. N = 20 and 23 cells across 4 experiments for DMSO and Wee1 inhibitor, respectively. H Effects of CDK1 inhibitors on wave area. CDK1 inhibitors tested in a larger screen; DMSO data run in parallel previously published in Extended figure 8 A of ref. 8. Analyzed by Kruskal-Wallis test with Dunn’s multiple comparisons was run. n = 151 and 212 cells across 3 experiments for Ro3306 and CGP74 conditions, respectively. I Effects of CDK1 knockdown on wave area. Kruskal-Wallis test with Dunn’s multiple comparisons. n = 60 cells across 3 experiments. J CDK1 knockdown (see Figure S2C). Means from 3 experiments. K Effects of GFP-FMNL1 WT and S1031A on wave; staining TOMM20 and phalloidin. GFP signal for ‘GFP alone’ condition was differentially scaled. L Wave areas analyzed by Kruskal-Wallis test, Dunn’s multiple comparisons; 40 cells across 4 experiments. M Western blot of GFP-FMNL1 WT and S1031A. N Mean fluorescence: GFP-FMNL1 WT/S1031A. Bars indicate means of triangles, which represent means of 4 biological replicates. O Effects of S1031E on wave; staining for TOMM20 and phalloidin. P Effects on wave area; two-sided Mann-Whitney test, 60 cells across 3 experiments. Q Western of GFP-FMNL1 S1031E. R Mean fluorescence: GFP-FMNL1 WT/S1031E. A–R Scale bars: 10 μm for cell images, 2 μm for insets. For blots, antibody/total protein approximately aligned/scaled the same; kDa, unit of molecular weight. Box plots: center lines indicate medians, plus signs indicate means, error bars = 10–90th percentile. Source data provided. *, **, and *** indicate p-values of < 0.05, ≤ 0.005, and ≤ 0.0005 respectively.

