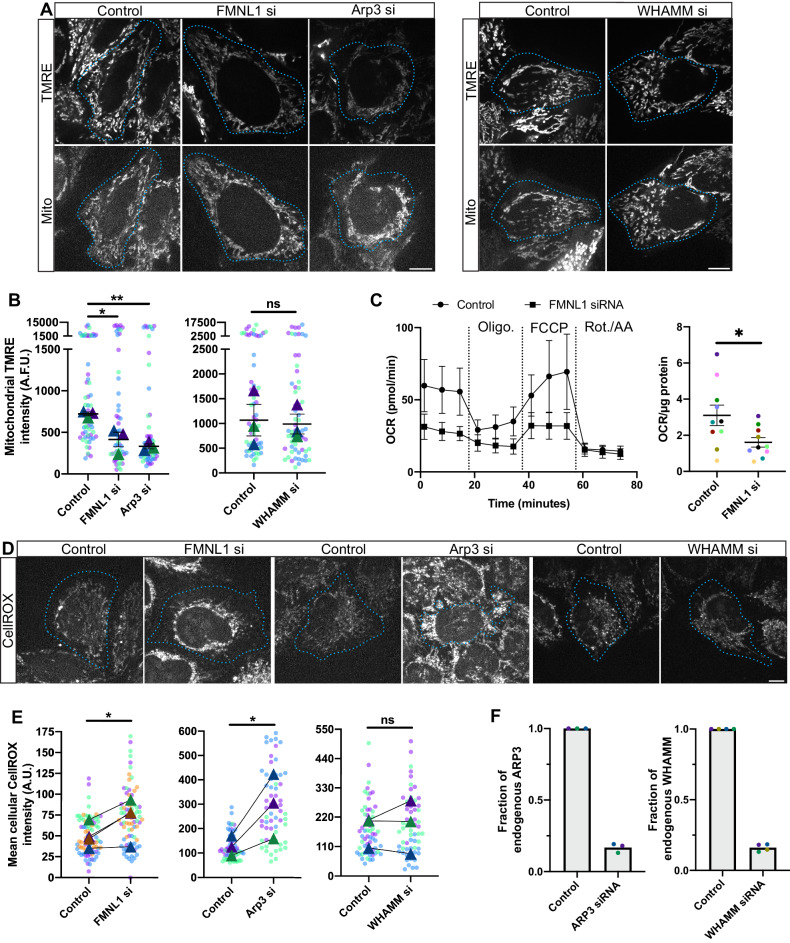
Fig. 3. The interphase actin wave maintains mitochondrial homeostasis.
A Representative images of TMRE (mitochondrial membrane potential indicator, incubated at 45 nM for 15 mins) and Mito-sBFP2 in live interphase HeLa cells treated with siRNA to FMNL1, ARP3, or WHAMM. Shown in cyan are outlines of cells as determined by Mito-sBFP2 signal. B Average mitochondrial TMRE intensity per cell. Triangles represent medians, bars are means with SEM. Left panel, data analyzed by one-way ANOVA with Dunnett’s multiple comparison test. Right panel, data analyzed by a two-sided Student’s T test. Note break in Y axis, where top and bottom segments are differentially scaled. n = 3 biologically independent experiments. C OCR from FMNL1 knock-down and control cells analyzed using Seahorse Bioanalyzer; example traces and quantitation across multiple independent experiments are shown. In trace, points are means and error bars represent SD. In graph, lines indicate means, error bars represent SEM, and a two-sided Student’s T test was applied. n = 10 biological replicates. D Representative images of CellROX (cellular ROS indicator, incubated at 1:500 for 30 min) in live interphase cells treated with siRNA to FMNL1, ARP3, or WHAMM. Outlines of cells in cyan determined by CellMask signal. E Quantitation of average cellular CellROX intensity, triangles represent means, two-sided ratio paired-T tests were used for statistical analysis. For Control vs. FMNL1, n = 4 biologically independent experiments. For other comparisons n = 3 biologically independent experiments. F Quantitation of western blot experiments examining knock-down efficiencies of ARP3 and WHAMM siRNAs. Bars represent means. n = 3 and 4 biological replicates for ARP3si and WHAMMsi comparisons, respectively. A–F Scale bars are 10 μm. ≥ 3 independent experiments. Different colors in graphs represent different biological replicates. Source data are provided as a Source Data file. *, **, and *** indicate p-values of < 0.05, ≤ 0.005, and ≤ 0.0005 respectively.

