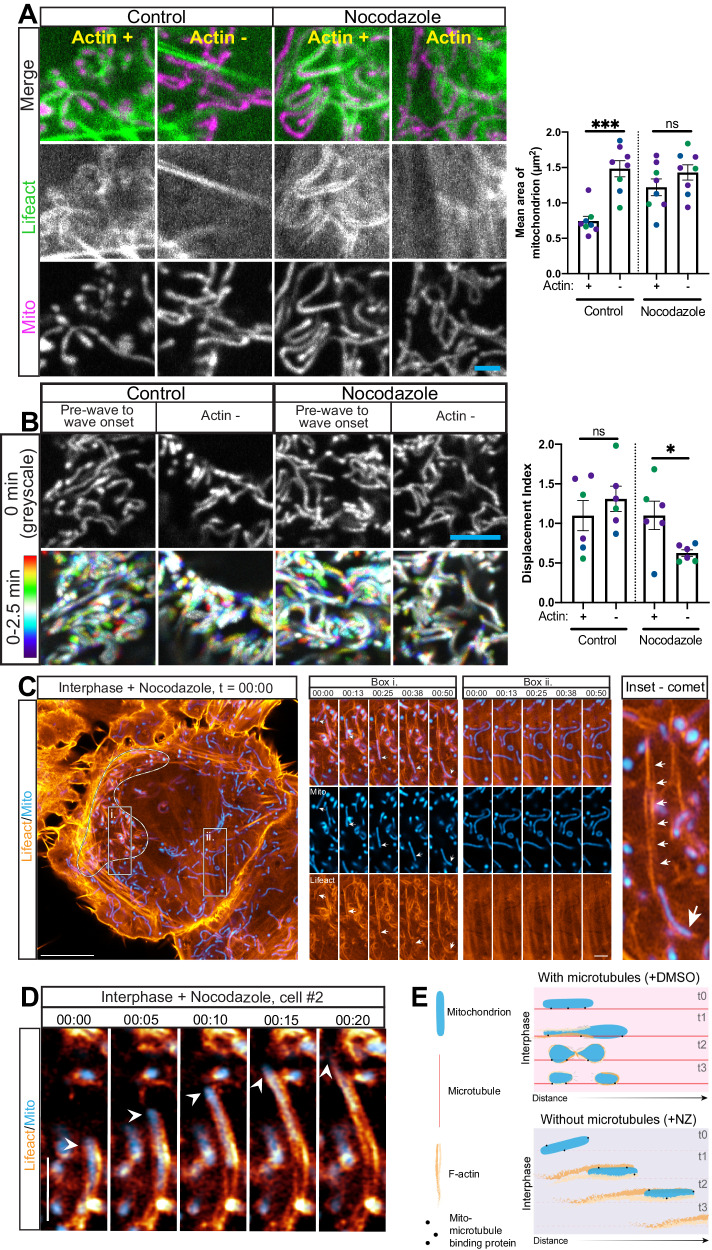
Fig. 6. Mitochondrial tethering to microtubules allows actin wave to fragment mitochondria.
A Representative images of live interphase cells expressing mito-DsRed2 and Lifeact-eGFP after 1 h treatment with DMSO or 25 μM nocodazole, and quantitation of mitochondrial size. n = 8 across 3 independent experiments. Scale bar is 2 μm. B Cumulative time projections of mitochondria sampled by the actin wave or outside of the actin wave over 2.5 min in either a 1.5–3 h 25 μM nocodazole treated interphase HeLa cell, or a control cell. Probe is Mito-dsRed2. Scale bar is 5 μm. Display scaling between control and nocodazole conditions is not equal for ease of viewing. Also shown is the displacement index of actin-positive and actin negative mitochondria in nocodazole-treated and control interphase cells. n = 6 cells over 3 independent experiments. C Airyscan. Actin comet tail (Lifeact-eGFP, orange) associated with a mitochondrion (mito-DsRed2, blue) in a 1 h 10 μM nocodazole treated interphase HeLa cell. Scale bar is 10 μm left, 2 μm right. Cell also expressing Halo-Sec61B and labeled with Janelia Fluor 635 (not shown). D Another example from a separate cell of actin comet tail (Lifeact-eGFP, orange) associated with a mitochondrion (mito-DsRed2, blue) in a 1 h 10 μM nocodazole treated interphase HeLa cell, obtained by airyscan imaging. E Schematic indicating potential effects of actin assembly on mitochondria either bound to or dissociated from microtubule tracks. A–E For graphs, differently colored points represent independent experiments. Also, a two-sided Student’s t-test was applied for statistical analyses. Further, means are depicted and error bars represent SEM. For each cell observed an actin-positive and -negative measurement was taken. Source data are provided as a Source Data file. *, **, and *** indicate p-values of < 0.05, ≤ 0.005, and ≤ 0.0005 respectively.

