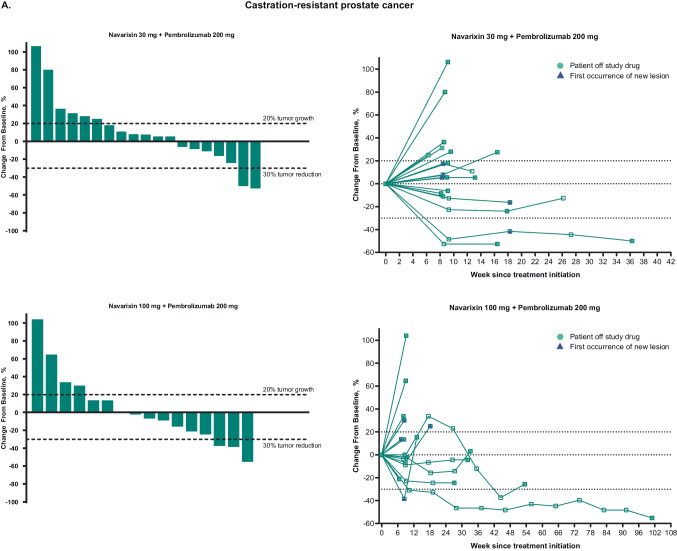
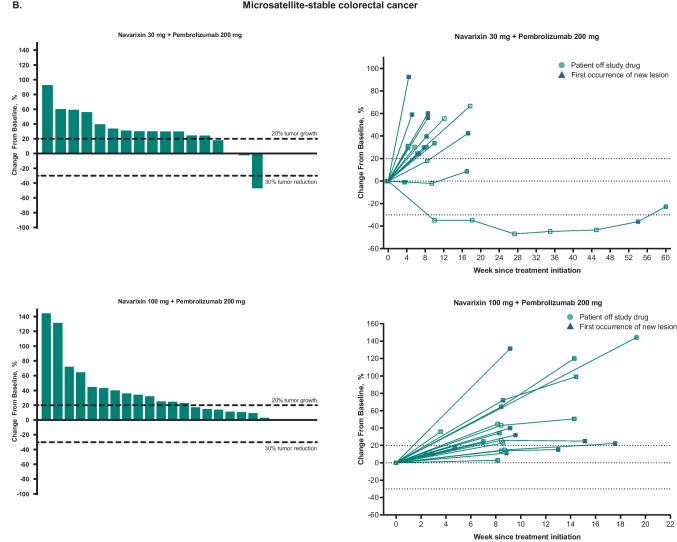
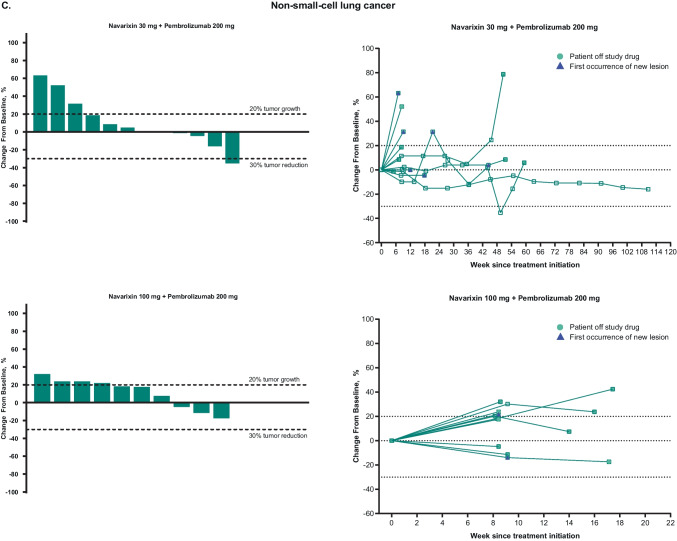
Fig. 1.
Maximum percentage change from baseline in target lesions and spider plots of percentage change from baseline for target lesions, based on investigator assessment per Response Evaluation Criteria in Solid Tumors version 1.1, in patients with A castration-resistant prostate cancer, B microsatellite-stable colorectal cancer, and C non–small-cell lung cancer. The last assessment before discontinuation of study drug (or within 1 cycle of discontinuation of study drug) is plotted as ‘Patient off study drug’ in the spider plots


