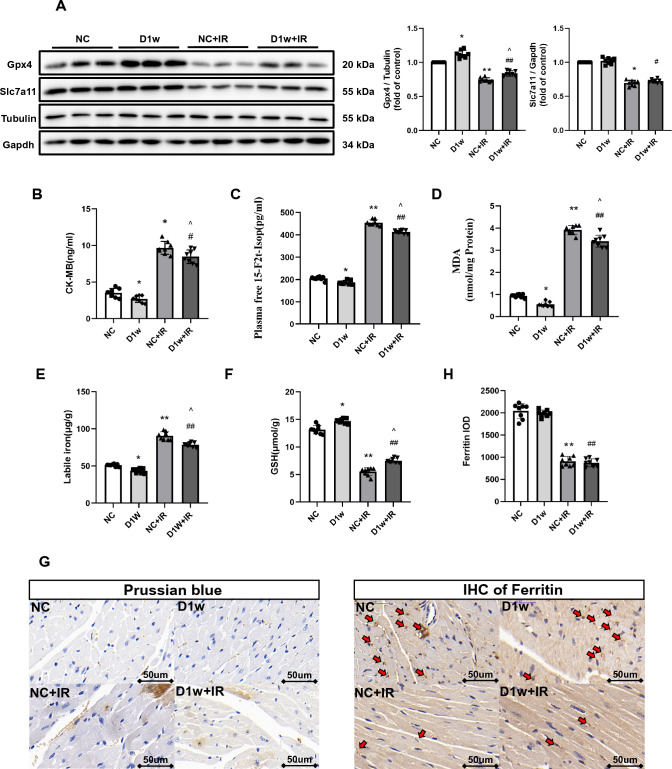
Fig. 2.
The MIRI in the first week of diabetic mice. C and A Expression of Gpx4 and Slc7a11 in mice with DM, assessed using Western blotting. B Levels of serum CK-MB, measured after reperfusion using the CK-MB ELISA kit. C and D Lipid peroxidation in DM mice, assessed by observing the changes in MDA and 15-F2t-IsoP levels. E Labile iron levels in DM mice, assessed using the Iron Colorimetric Assay Kit. F Alterations of GSH levels, assessed using the Glutathione Fluorometric Assay Kit. G Prussian blue stain showed abnormal iron deposition (brown) in myocardium, with the iron deposition increasing after IR, but little difference between D1w and control group. H Expression and the integrated optical density (IOD) of Ferritin assessed using IHC in myocardium (brown, arrow head) and, showing no difference between D1w + IR and NC + IR group. The magnifications is 40 times. Date are expressed as mean ± SD, n = 8 mice per group. *p < 0.05, **p < 0.01, versus NC group; #p < 0.05, ##p < 0.01, versus D1w group; ^p < 0.05, ^^p < 0.01, versus NC + IR group. There is no significant statistical difference between groups without annotation symbols. D1w Diabetes for 1 week

