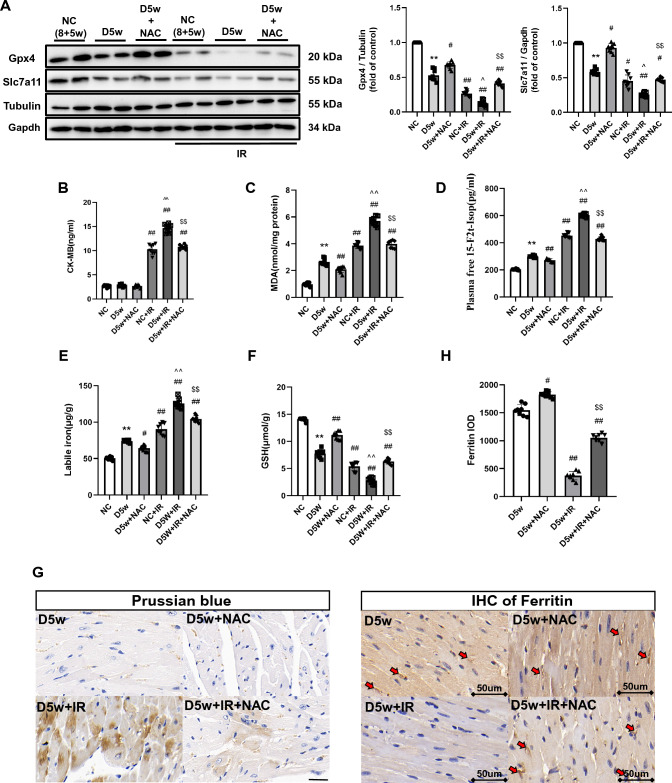
Fig. 4.
The MIRI with or without NAC treatment in the fifth week of diabetic mice. A Expression of Gpx4 and Slc7a11 in mice with DM, assessed using Western blotting. B Levels of serum CK-MB, measured after reperfusion using the CK-MB ELISA kit. C and D Lipid peroxidation in DM mice, assessed by observing the changes in MDA and 15-F2t-IsoP levels. E Labile iron levels in DM mice, assessed using the Iron Colorimetric Assay Kit. F Alterations of GSH levels, assessed using the Glutathione Fluorometric Assay Kit. G Prussian blue stain showed abnormal iron (brown) deposition in myocardium. Further increase in iron deposition was observed in D5w + IR group, while this enhancement of iron deposition was significantly reduced after 4 week of NAC treatment. H Expression of Ferritin assessed using IHC in myocardium (brown, arrowhead), Positive of Ferritin could hardly be detected after IR in D5w mice, but the degradation of Ferritin was significantly inhibited by NAC treatment for 4 week. The magnifications is 40 times. Date are shown as mean ± SD, n = 8 mice per group. *p < 0.05, **p < 0.01, versus NC group; #p < 0.05, ##p < 0.01, versus D5w group; ^p < 0.05, ^^p < 0.01, versus NC + IR group; $p < 0.05, $$p < 0.01, versus D5w + IR group. There is no significant statistical difference between groups without annotation symbols (p > 0.05). D5w Diabetes for 5 week; D5w + NAC Diabetes for 5 week and NAC treatment for 4 week

