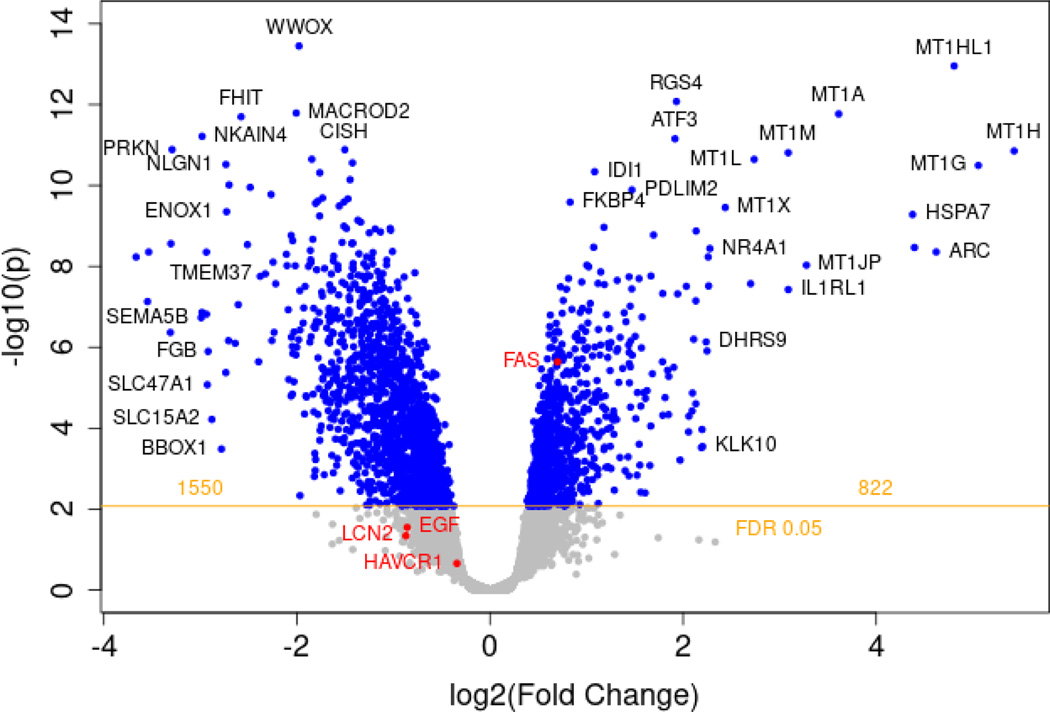
Figure 2.
Volcano plot of all differentially regulated genes between polymyxin E and control.
RNAseq analyses shows differentially expressed genes after 72 hr of polymyxin E versus control exposure in MPS. MPS were populated from PTECs from three different donors with 16 MPS controls and 19 MPS treated with polymyxin E. 2,372 differently expressed genes were identified with polymyxin E exposure relative to controls. The increase or decrease in gene expression from control to polymyxin E is shown in the x-axis as a log2(fold change) value, and its corresponding significance value is shown on the y-axis as a -log10(p) value. Blue dots represent individual genes. Genes with a log2(fold change) greater than zero indicate an increase in expression. Greater significance is indicated by greater values on the y-axis, with a threshold of statistical significance indicated by the horizontal yellow line, with a calculated FDR of 0.05. The pro-apoptotic Fas gene annotated in red saw an increase in expression: log2 fold-change=0.70, FDR=7.29×10⁻⁵. Also highlighted in red are EGF, KIM-1 (HAVCR1), and NGAL (LCN2). UMOD was not detected.

