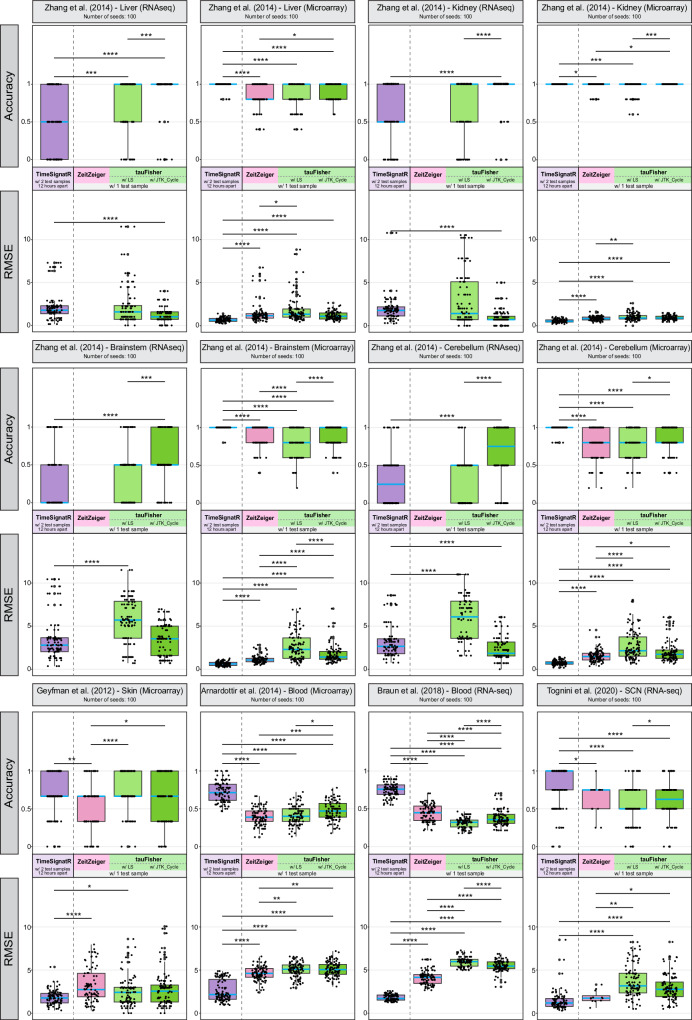
Fig. 2. tauFisher requires only one test sample and performs well in both accuracy and RMSE for transcriptomic data collected from various organs and assay platforms.
The blue line inside each box indicates the median. The bounds of the box represent the first and third quartiles. The upper and lower whiskers extend to the largest and smallest value within 1.5 times the inter-quartile range, respectively. NAs are excluded from the plot. RMSE: root mean square error. *: p-value ≤ 0.05, **: p-value ≤ 0.01, ***: p-value ≤ 0.001, ****: p-value ≤ 0.0001. P-values are determined using the Wilcoxon rank-sum test and adjusted using Bonferroni correction. For each dataset, n = 100 randomly generated training-testing partitions. Source data and exact p-values are provided as a Source Data file.

