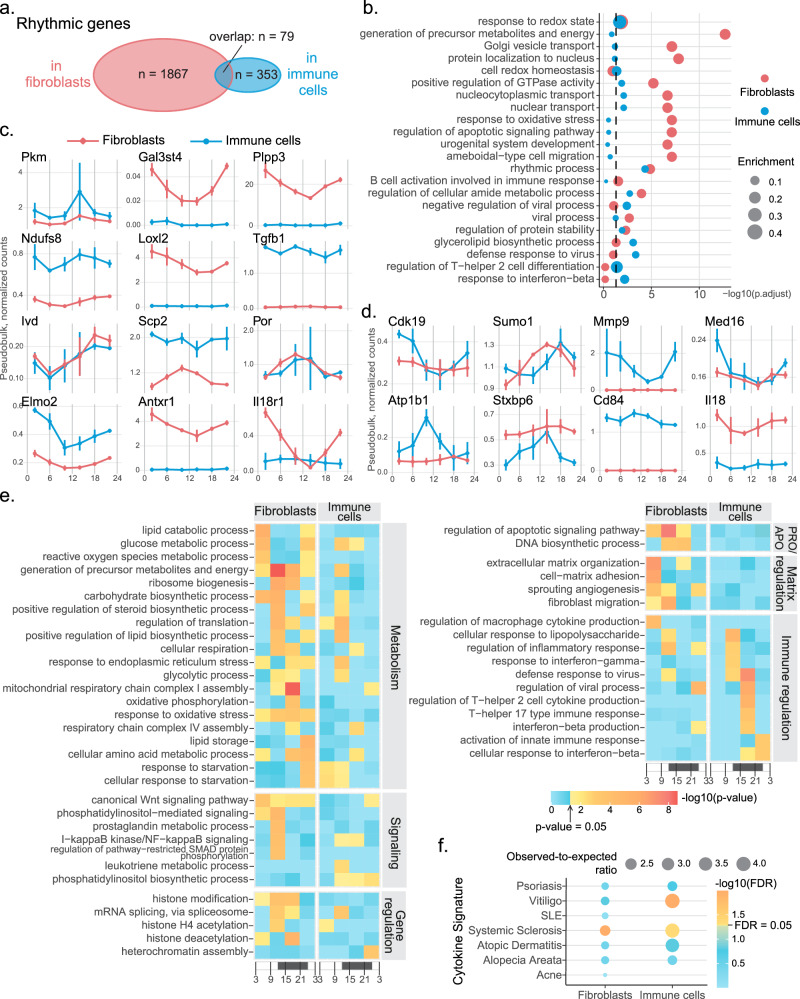
Fig. 5. Different rhythmic processes are present in mouse dermal fibroblasts and immune cells.
a JTK_Cycle identified 1946 rhythmic genes in dermal fibroblasts (red) and 432 rhythmic genes in dermal immune cells (blue). Only 79 rhythmic genes are shared by the two cell types. b Gene Ontology analysis performed on rhythmic genes in fibroblasts (red) and immune cells (blue) reveals divergent biological processes being diurnally regulated in the two cell types. The dot size represents the enrichment score. The vertical dashed line marks adjusted p-value = 0.05. P values are determined using a hypergeometric test and adjusted using the Benjamini-Hochberg procedure. Expression of some of the rhythmic genes found in fibroblasts (c), and immune cells (d). n = 3 biologically independent samples per circadian time point. Data are presented as mean values +/− SD. e A heatmap showing p-values for some of the biological processes enriched by rhythmic genes peaking during each quarter-day time range. Color represents p-value. Blue: insignificant; yellow to red: significant with red representing a lower p-value. P-values are determined using hypergeometric test. x-axis represents time, with white being day and black being night. f Rhythmic genes in mouse dermal fibroblast and immune cells significantly enrich for genes within 200 kb of the GWAS signals of immune-mediated skin conditions. Blue: insignificant; yellow to orange: significant with orange representing lower FDR; FDR false discovery rate. Source data are provided as a Source Data file.

