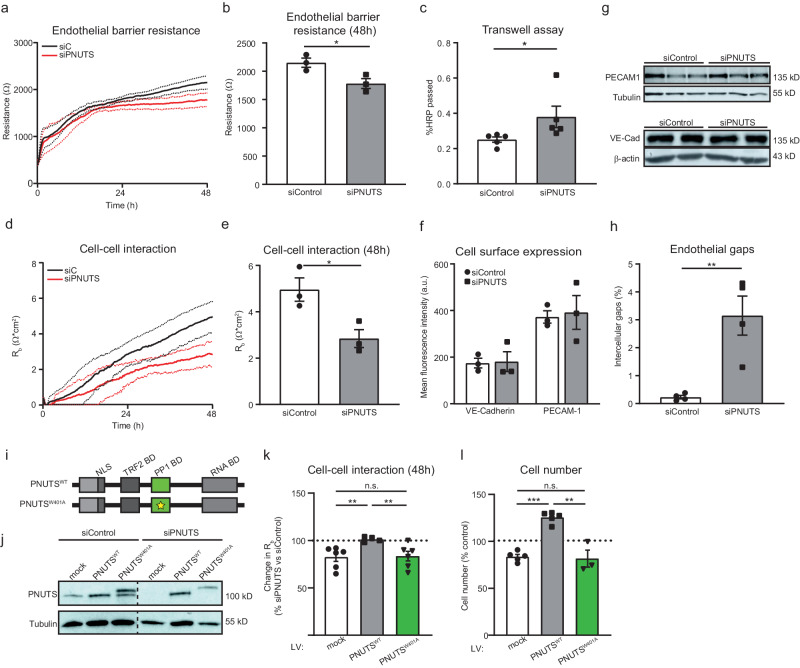
Fig. 4. PNUTS is necessary for endothelial barrier function independently of cell junction gene expression.
a–h HUVECs were treated with siRNA (si) targeting PNUTS or a control sequence. a-b) HUVEC barrier resistance was assessed by ECIS at 4000 Hz for 48 h, presented as average resistance ± SEM of n = 3 experiments, 8 biological replicates per group and experiment. c HUVECs were seeded in transwells and HRP passage through the endothelial monolayer was assessed by absorption measurements (450 nm) and shown as percentage of total HRP (n = 5). d, e Cell-cell interaction was assessed by modeling of data obtained by ECIS measured as Rb (Ω*cm2); presented as average resistance ± SEM of n = 3 experiments, 8 biological replicates per group and experiment. f Cell surface presence of PECAM1 and VE-cadherin was assessed by flow cytometry 48 h after siRNA transfection (n = 3). g Total PECAM1 and VE-cadherin levels were assessed by Western Blotting (WB). Tubulin and β-actin expression was used as loading control. h Cells were grown into confluence and immuno-stained for VE-cadherin, PECAM1 and F-actin. DAPI was used to stain nuclei. The presence of intercellular gaps in endothelial monolayers was measured by quantifying the intercellular areas versus the total area in 4 fields per image, 3 images per experiment, n = 4. i Schematic representation of the PNUTS lentiviral vectors used for the barrier rescue experiments. Both vectors included silent mutations in the seed sequence of siPNUTS. HUVECs were transduced with the indicated constructs for 8–10 days and later transfected with siControl or siPNUTS to silence endogenous expression of PNUTS, before subjecting them to ECIS and cell counting (4–6 independent experiments, 4 biological replicates per group and experiment). j PNUTS expression in total cell lysates of HUVECs treated with indicated vectors and siRNAs was analyzed by WB, Tubulin was used as a loading control. Representative WB is shown. k Change in cell-cell interaction measurement from ECIS 48 h after cell seeding, measured as variation of Rb of siPNUTS- vs siControl-treated cells. l Cell proliferation of ECIS-assayed HUVECs, measured as % number of cells relative to control. *p < 0.05, **p < 0.01, ***p < 0.001. Error bars depict the standard error of the mean (SEM).

