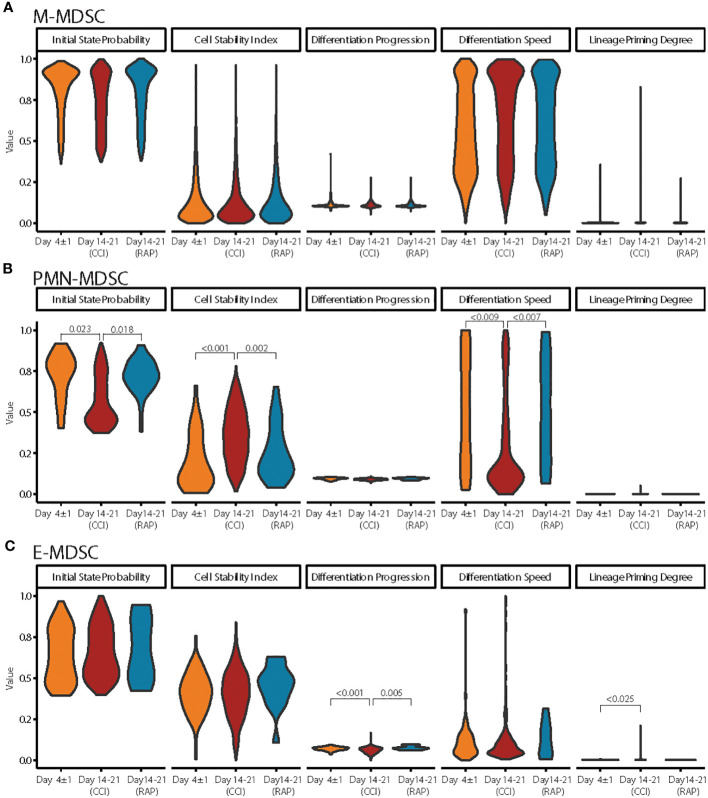
Figure 9.
Differences in PMN-, E-, and M-MDSCs across septic time-points. (A) Cell dynamic parameters estimated from CellRank were compared across cells from septic patients at Day 4 ± 1 (acute sepsis) (n=4), patients at day 14-21 who rapidly recovered (“RAP”) (n=4), and patients at day 14-21 who developed chronic critical illness (“CCI”) (n=5) in M-MDSCs. (B, C) Similar to (A) for PMN-MDSCs and E-MDSCs, respectively. Significant p-values (< 0.05) were obtained from fitting a linear mixed model. E, early; PMN, granulocytic; H, hybrid; M, monocytic.

