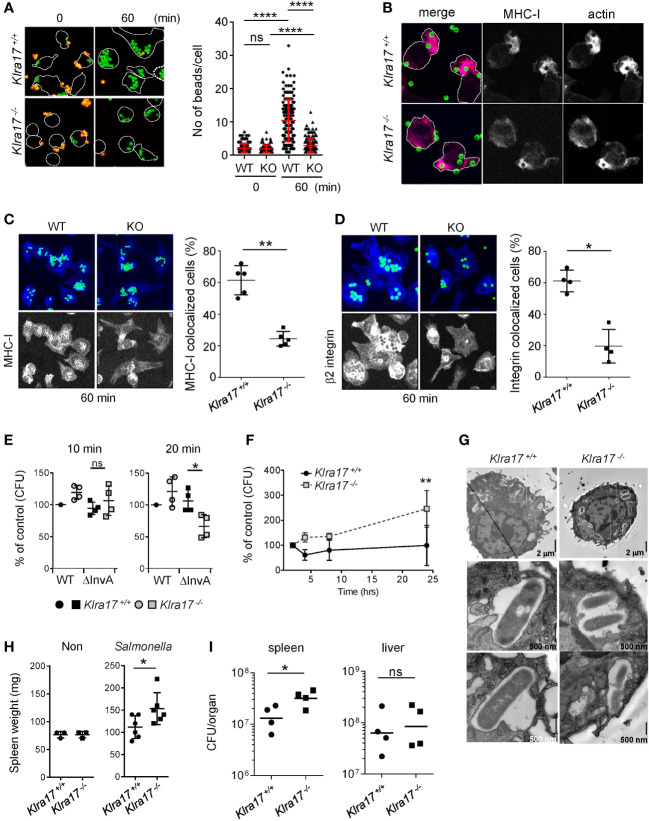
Figure 1.
Ly49Q is needed for Mϕ phagocytosis and protection from Salmonella infection. (A) Phagocytosis of IgG-opsonized, fluorescence-labeled, 2-µm-diameter latex beads by PEMϕ. Surface-bound beads were discriminated by staining with Alexa594-conjugated anti-mouse IgG antibody without cell permeabilization. The numbers of green fluorescent beads within a cell were counted, and more than 25 cells in each sample were analyzed. (B) Immunofluorescence images showing colocalization of MHC-I and F-actin in PEMϕs after incubation with fluorescence-conjugated latex beads (ϕ2 µm). (C, D) Immunofluorescence staining of MHC-I (C) and β2 integrin (D) 60 min after latex beads were added (left). Five nonoverlapping pictures including more than 30 cells were randomly taken, and the frequency of cells showing colocalization of MHC-I with beads was determined (right). MHC-I and β2 integrin were visualized by Alexa647-conjugated secondary anti-rat IgG antibody. In these experiments, unlike A and B above, opsonized beads were not stained with Alexa594-conjugated anti-mouse IgG antibody. The merged area of the beads (FITC) and MHC-I/β2 integrin (Alexa647) was detected as light blue, while MHC-I and B2 integrin were detected as blue, with blue accumulation at the bottom and around the beads. To better visualize the localization of MHC-I and β2 integrin, the blue region was extracted and displayed in black and white contrast. (E) Attachment and invasion of WT and noninvasive Salmonella Tiphi (ΔinvA) into PEMϕs was examined as described in Methods. (F) Survival and proliferation of Salmonella Tiphi were followed for 24 hours after infection. (G) Electron microscopy analyses of Salmonella ingested by PEMϕ. White boxes in the upper photographs indicate areas enlarged in the bottom images. (H) Weights of spleens before and after Salmonella infection. (I) Bacterial titers in the spleens and livers were determined for mice infected with Salmonella. CFU; colony-forming units. Data points represent organs from a single mouse. Statistical analyses were conducted using Mann–Whitney U test. ****P<0.0001; **P<0.01; *P<0.05; ns, not significant. All results shown are representative of at least two separate experiments.

