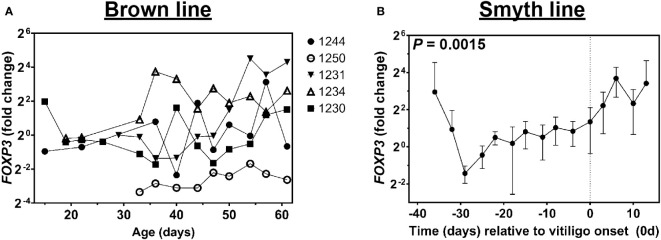
Figure 7.
Expression of FoxP3 in growing feathers of parental-control, non-vitiligo expressing Brown line chickens and vitiligo-expressing Smyth chickens. Growing feathers were sampled from Brown line (A) and Smyth (B) chickens beginning at 1-day post-hatch and continued twice a week for 113 days. (A) cDNA from samples collected from 8 to 61 days of age were analyzed for relative gene expression of Foxp3. Gene expression profiles were obtained for individual chickens, using individual-specific day 29 samples as calibrators and 28S as a reference gene. (B) cDNA from samples collected from 39 days prior to- through 13 days post-vitiligo onset were analyzed for relative gene expression of FoxP3. Data for vitiligo-expressing Smyth chickens were aligned by time (days) relative to age of vitiligo onset (set to 0 d and indicated by vertical dashed line). Smyth chickens were 43 to 57 days of age at time of vitiligo onset. The overall effect of time was determined using a mixed effects regression model setting time and individual bird as a fixed and random effect respectively. When a significant time effect was found, post-hoc multiple means comparisons were made against the -39 d and 8 d samples for Smyth and Brown line respectively, using the Tukey-Kramer p-value adjustment. Differences were considered significant at P < 0.05. Relative gene expression was determined by the efficiency-calibrated ΔΔCt method and is expressed as fold change relative to the calibrator sample. Data are plotted as mean ± SEM; n = 3 to 8 and 5 chickens per time point for Smyth and Brown line respectively.

