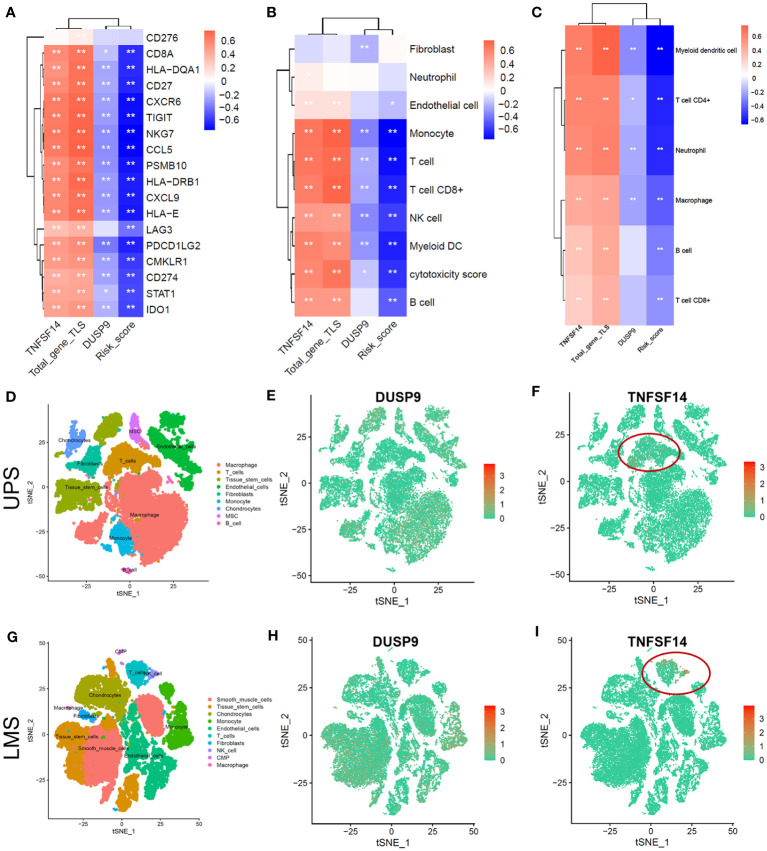
Figure 5.
Tumor microenvironment analysis of soft tissue sarcoma in TCGA and single-cell dataset. (A-C) Correlation heatmap between total-gene TLS score, Risk score, DUSP, and TNKSF14 with 18 immune-related genes (A), MCPcounter immune cells (B), and TIMER2.0 immune cells (C). (D-F) The tSNE plot of Tumor microenvironment cell-clusters (D), DUSP9 (E), and TNFSF14 expression (F) in undifferentiated pleomorphic sarcoma (UPS) patients. (G-I) The tSNE plot of Tumor microenvironment cell-clusters (G), DUSP9 (H), and TNFSF14 expression (I) in leiomyosarcoma (LMS) patients.

