Figure 2.
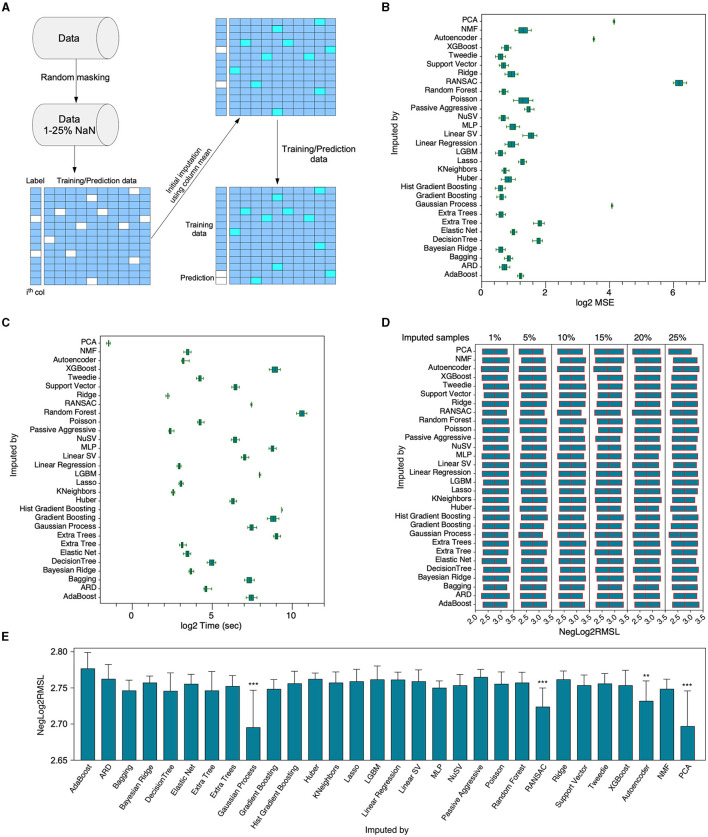
Comparative evaluation of various algorithms' functionality. (A) A composite dataset consisting of RNAseq and microarray data, dimensioned at 1770 X 400, underwent random masking to instigate missing values, ranging from 1% to 25%, thus creating 25 distinct data matrices. In the case of unsupervised learning algorithms, namely autoencoder, NMF, and PCA, the imputation of the entire dataset was accomplished via the column mean through SimpleImputer prior to the execution of the algorithm. For supervised algorithms, an initial identification of columns with NaNs was carried out. An individual column containing NaN was isolated and designated as the label, while the remainder of the data underwent imputation via the column mean with the aid of SimpleImputer. Following the preliminary imputation, the data was segregated into training and predictive datasets corresponding to non-NaN and NaN rows in the label column. (B) Subsequent to imputation with a specific algorithm, imputed values underwent a comparative analysis with their original counterparts, facilitating the determination of the mean squared error. Each box demonstrates 25 measurements employing missing values varying from 1%-25% (in increments of 1%), while the bar represents the minimum to maximum values range. (C) The duration necessitated to carry out imputation utilizing a specific algorithm. (D–E) Six imputed datasets were employed to ascertain the prediction performance of the Trametinib response via the XGBoost algorithm. **p < 0.01 and ***p < 0.001.

