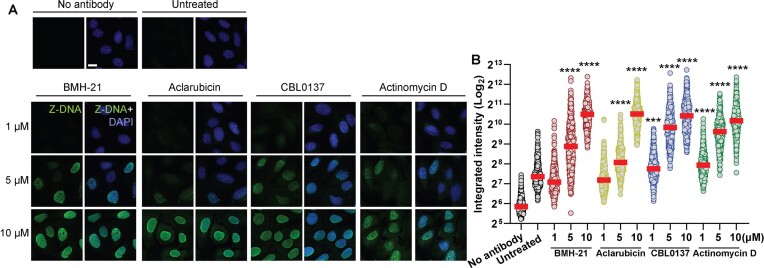
Figure 7.
DNA intercalators induce the formation of Z-DNA. (A) Representative images and (B) signal quantification of immunofluorescence analysis of Z-DNA in U2OS cells treated with increasing concentrations of BMH-21, Aclarubicin, CBL0137 and Actinomycin D for 90 minutes. Scale bar 10 μm. Integrated intensity (arbitrary units) was analyzed (n > 300 cells per condition) by one-way ANOVA test compared to untreated, ***P value < 0.001, ****P value < 0.0001.

