Figure 3.
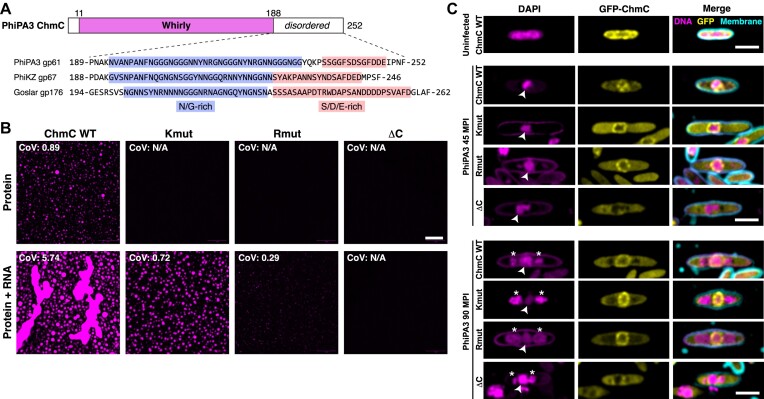
ChmC forms phase-separated condensates with RNA (A) Top: Domain structure of PhiPA3 ChmC, with Whirly domain colored magenta and regions predicted to be disordered in white. Bottom: Sequence of the C-terminal predicted disordered domain in ChmC from PhiPA3 (gp61), PhiKZ (gp67), and Goslar (gp176). Asparagine/glycine (N/G) rich regions are highlighted in blue, and serine/aspartate/glutamate (S/D/E) rich regions are highlighted in salmon. See Supplementary Figure S4A for catGRANULE analysis of all three proteins, and Supplementary Figure S3D-E for analysis of ChmC ΔC binding DNA and RNA. (B) Fluorescence microscopy imaging of PhiPA3 ChmC (wild type, Kmut, Rmut, or ΔC; 10% Cy5-labeled) at 30 μM protein concentration, either alone (top row) or with 83 nM of a 2.3 kb RNA (5.8 μg/ml; bottom row). All images were taken 30 min after final dilution and mixing with RNA. For all conditions that showed condensate formation, the coefficient of variation (CoV) was calculated as the standard deviation of particle area divided by the mean particle area (WT protein alone n = 423; WT + 40 base RNA n = 222; Kmut + 40 base RNA n = 247; Rmut + 40 base RNA n = 5; WT + 2.3 kb RNA n = 552; Kmut + 2.3 kb RNA n = 368; Rmut + 2.3 kb RNA n = 147). Scale bar = 30 μm. See Supplementary Figure S4B for DIC imaging. (C) Localization of GFP-tagged PhiPA3 ChmC (wild type, Kmut, Rmut, or ΔC in PhiPA3-infected P. aeruginosa cells at 45 and 90 min post infection (MPI). Yellow: GFP; magenta: DAPI nucleic acid; cyan: FM4-64 membrane dye. Arrowheads indicate phage nuclei, and asterisks indicate phage bouquets. Scale bar = 2 μm.

