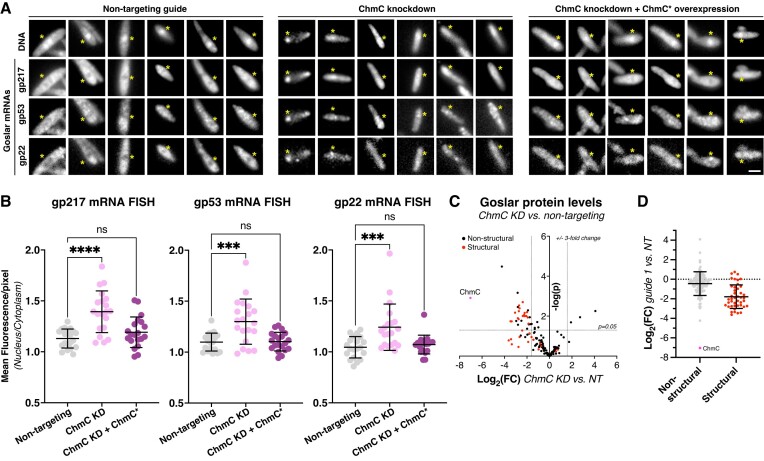
Figure 6.
ChmC knockdown causes a global reduction in phage protein levels. (A) Fluorescence microscopy of Goslar-infected E. coli cells expressing dCas13d and a non-targeting guide RNA (Non-targeting; left panels), a chmC-targeting guide RNA (ChmC knockdown; center panels), or a chmC-targeting guide RNA plus a separate recoded chmC gene (ChmC* overexpression; right panels). DNA is stained with DAPI, and Goslar genes encoding gp217, gp53, and gp22 are visualized by mRNA FISH (see Materials and Methods). The position of the phage nucleus, located based on DAPI fluorescence, is indicated with a yellow asterisk in each panel. Each column represents a single cell; six cells are shown per condition. Scale bar = 2 μm. (B) Quantification of mRNA FISH, represented as the relative fluorescence intensity per pixel within the phage nucleus versus the cytoplasm, for mRNAs encoding gp217 (left), gp53 (center), and gp22 (right). At least 20 cells per condition were measured. Individual data points are shown, and bars represent average plus/minus standard deviation. ns: not significant; ***P ≤ 0.001; ****P ≤ 0.0001 (Dunnett's multiple comparisons test). See Supplementary Figure S10A for the same data graphed as fraction of overall fluorescence per cell within the phage nucleus. (C) Waterfall plot showing changes in expression level (log2(fold change)) in ChmC knockdown versus non-targeting conditions, from label-free quantitation mass spectrometry (see Supplementary Table S5 for data). ChmC is shown as a pink dot and labeled. Putative virion structural proteins are shown in red; all other proteins are shown in black. Dotted lines indicate a ±3-fold change (x axis) and a P-value ≤0.05. (D) Log2(fold change) for non-structural proteins (gray; ChmC colored pink and labeled) and putative virion structural proteins (red) when comparing ChmC knockdown to non-targeting conditions. Individual data points are shown, and bars represent average plus/minus standard deviation. Average log2(fold change) for non-structural proteins = –0.44, and for structural proteins = –1.78. See Supplementary Figure S10B for mass spectrometry analysis of Goslar protein expression versus time of infection.

