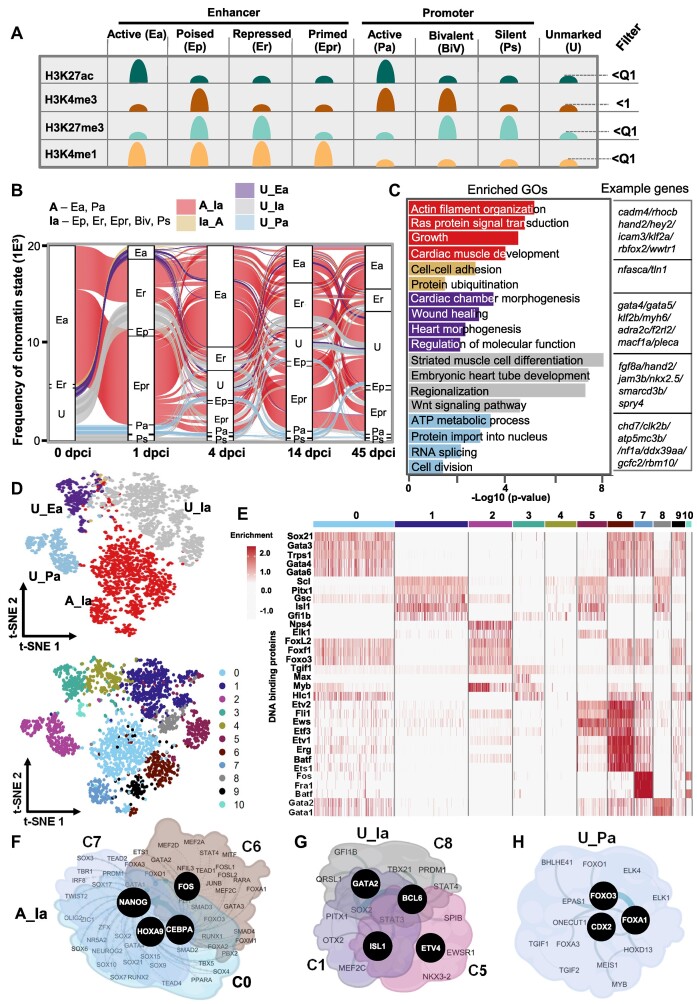
Figure 3.
Large-scale acquisition of repressive chromatin marks one day after heart injury. (A) Schematic representation of the different chromatin states. (B) Alluvial plot representing the dynamic of chromatin states in (A) with reference point 1 dpci. Activated enhancers and promoter areas (A) changing from active at 0 dpci to inactive (Ia) at 1 dpci (A_Ia, red). Inactive areas were the combination of Ep, Er, Epr, BiV and Ps. Transitions from inactive to active chromatin state at 1 dpci (Ia_A, light brown), unmarked areas to active enhancers (U_Ea, violet), unmarked areas to inactive chromatin states (U_Ia, grey), unmarked areas to active promoters (U_Pa, light blue). The Y-axis values are frequency of the assigned divergent region. Unmarked, represents genomic area without any significant enrichment of the studied histone marks, i.e. bellow the Quartile 1 (Q1) for H3K27ac, H3K27me3 and H3K4me1, and value of 1 for H3K4me3. (C) GO terms of the dynamic chromatin state groups presented in panels A and B. Example genes from each GO are presented to the right. (D) T-distributed stochastic neighbor embedding (t-SNE) visualization displaying the dynamic chromatin state transition groups (top) and the distribution of TF motifs (bottom). (E) Heatmap showing the enrichment of TF motifs in the clusters presented in (D, bottom panel). (F–H) Interaction network of TFs with enriched motifs in clusters associated with A_Ia transition (F), in clusters associated with U_Ia transition (G) and C2 associated with U_Pa transition (H).

