
FIGURE 5.
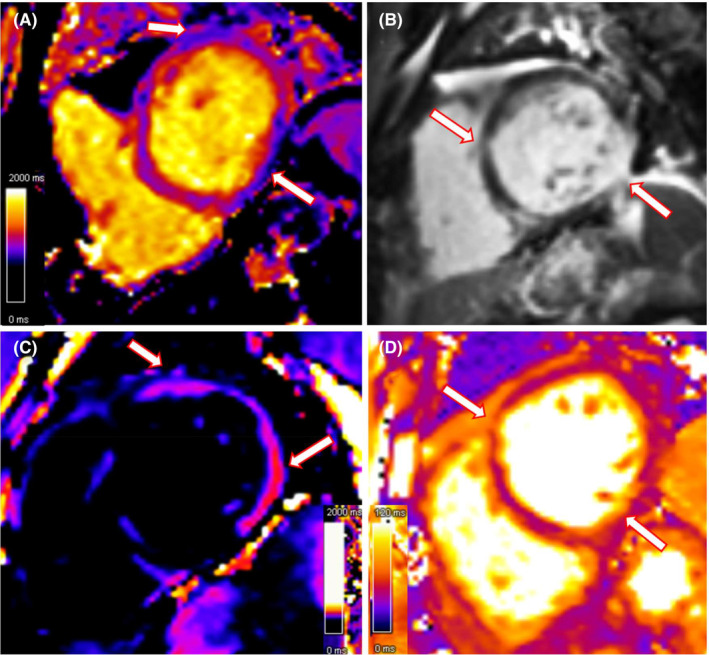
Cardiac MRI findings on HD 3, (A) Native T1 map showing regional prolonged T1 relaxation time, indicative of edema/hyperemia; (B) T1 delayed post contrast sequence demonstrate diffuse patchy areas of intramyocardial late gadolinium enhancement (LGE), mainly involving the inferolateral basal, anterolateral basal and anteroseptal wall (white arrows); (C) Corresponding prolonged T1 relaxation time in the LGE map confirms edema; (D) T2 map shows diffuse prolongation of relaxation time as a consequence of increased tissue water content (edema), which is a hallmark of myocardial inflammation.