
FIGURE 4.
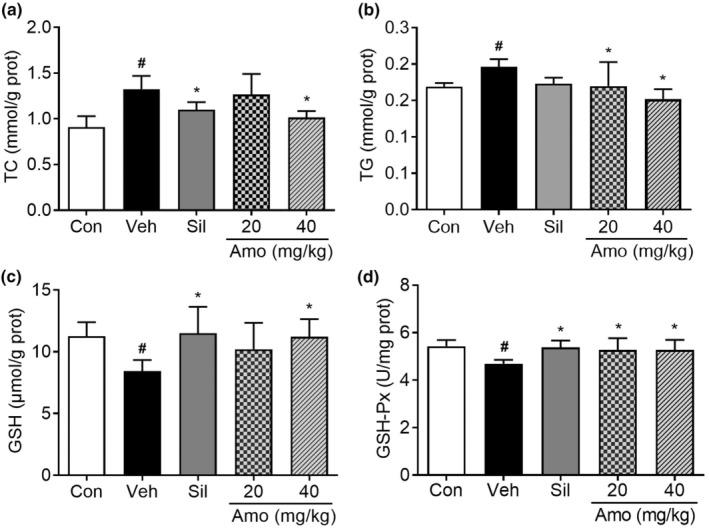
Effects of A. villosum on lipid metabolism and oxidative stress in the liver homogenates of ALD rats. The levels of TC (a), TG (b), GSH (c), and GSH‐Px (d) are shown. Data are represented as the mean ± 95% CI. # p < .05 compared with the Con group; *p < .05 compared with the Veh group. Amo, A. villosum group; Con, control group; Sil, silybin group; Veh, vehicle group.