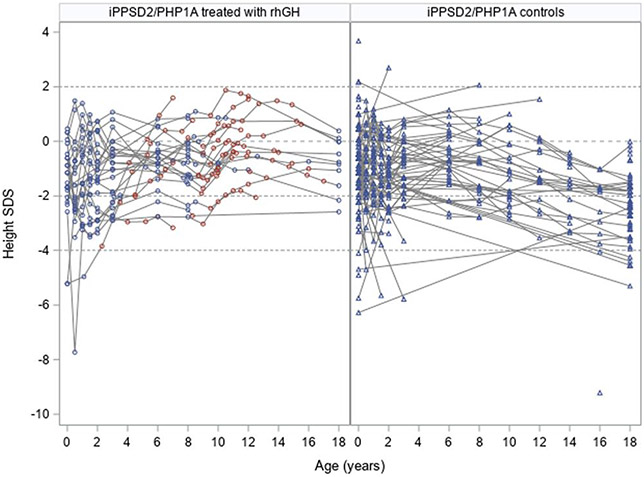
Figure 5.
Individual evolution of height in the study group. The iPPSD2/PHP1A participants treated with rhGH are depicted using circles: in blue for the time points before the therapy and in red for the measurements collected under active treatment. The height measurements for the iPPSD2/PHP1A controls are depicted using blue triangles. The gray interrupted lines indicate −2 and +2 SDS, representing the normal range for height.

