Fig. 2.

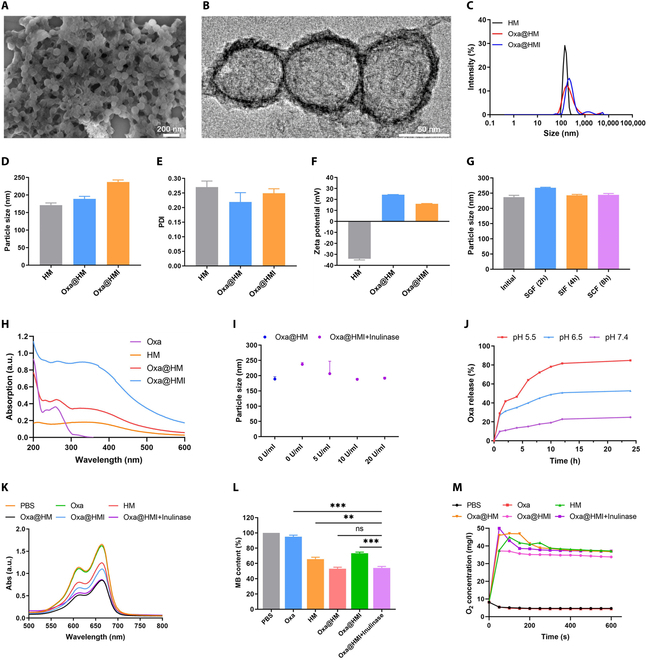
Preparation and characterization of Oxa@HMI NPs. (A) SEM image of Oxa@HMI NPs. (B) TEM image of Oxa@HMI NPs. (C) Size distribution of various NPs evaluated by dynamic light scattering analysis. Particle size (D), PDI (E), and zeta potential (F) of HM NPs, Oxa@HM NPs, Oxa@HMI NPs, respectively (n = 3). Particle size (G) of Oxa@HMI NPs after exposure to SGF, SIF, and SCF for 2, 4, and 8 h, respectively (n = 3). (H) UV-vis spectra of different solutions. (I) Particle size of NPs with or without inulin coating at conditions with inulinase of different concentrations (n = 3). (J) TME-responsive Oxa release profiles of Oxa@HMI NPs (with inulinase) at different pH values. UV-vis spectra (K) and representative absorption (L) of MB that degraded due to the •OH generated from various solutions with or without presence of inulinase. (M) O2 generation ability of different treatments in presence of H2O2 (100 μM). The data are presented as mean ± SD. **P < 0.01, ***P < 0.001; ns, no significance.
