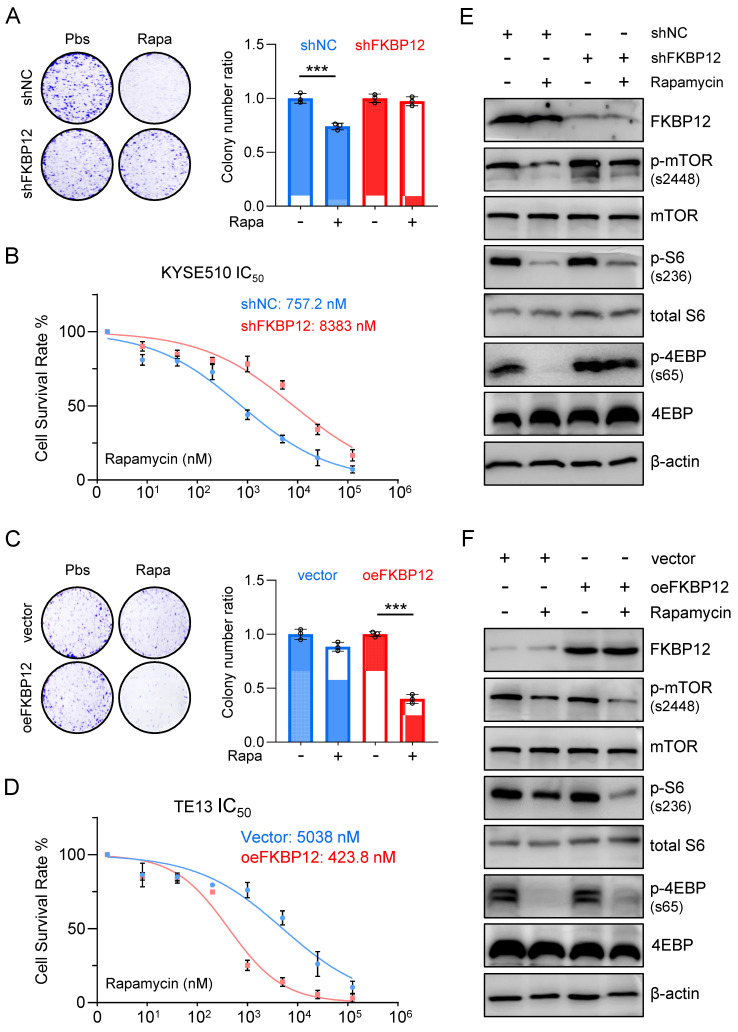
Figure 4.
Silencing FKBP12 phenocopies HMGA1 deficiency. (A) Colony-forming units in KYSE510 cells with or without FKBP12 silencing (control vs shFKBP12). Simultaneously, the cells were treated with 1 μM rapamycin for 48 h. Representative images of colony formation are shown. (B) KYSE510 cells with or without FKBP12 knockdown were treated with rapamycin in a concentration gradient (starting at 8 nM and increasing fivefold each time). Cell viability was measured using the CCK8 assay. (C) Colony-forming units in TE13 cells with or without FKBP12 overexpression (vector vs oeFKBP12). Simultaneously, the cells were treated with 1 μM rapamycin for 48 h. Representative images of colony formation are shown. (D) TE13 cells with or without FKBP12 overexpression were treated with rapamycin in a concentration gradient (starting at 8 nM and increasing fivefold each time). Cell viability was measured using the CCK8 assay. (E) FKBP12, mTOR downstream effectors, and beta-actin (loading control) in KYSE510 cells transduced with shFKBP12 were detected with immunoblot. Extracts of ESCC cells were collected 24 h after 1 μM rapamycin treatment. (F) FKBP12, mTOR downstream effectors, and beta-actin (loading control) in TE13 cells transduced with lentivirus-expressed FKBP12 were detected with immunoblot. Extracts of ESCC cells were collected 24 h after 1 μM rapamycin treatment.

