Figure 2.
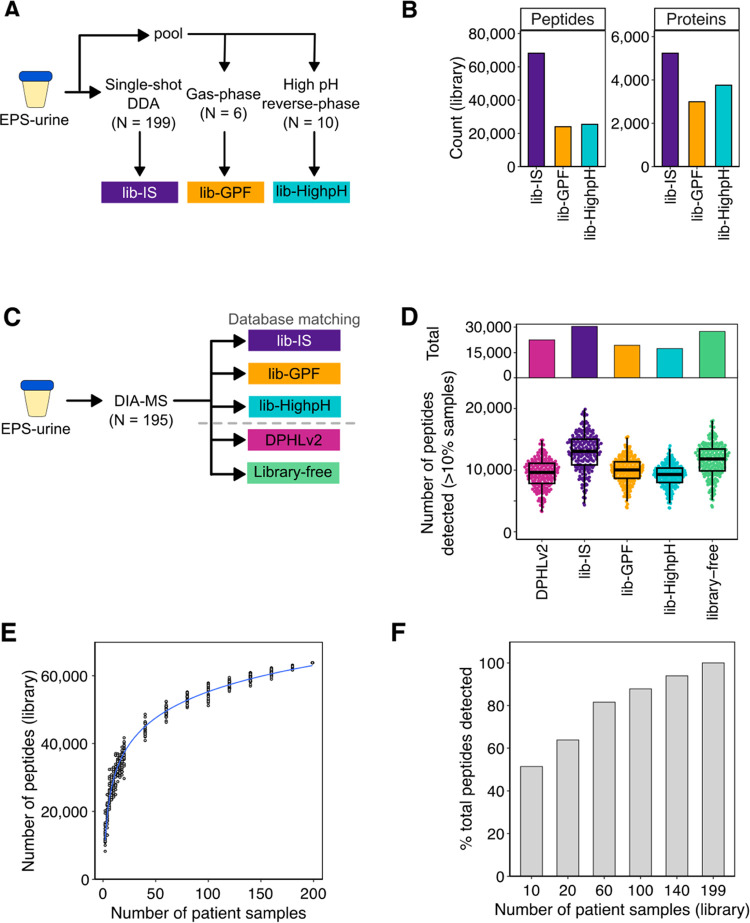
Evaluation of commonly used DIA-MS data analysis approaches for EPS-urines. (A) Schematic of the sample-specific spectral libraries. (B) Library size of the generated sample-specific spectral libraries. (C) Schematic of DIA-MS data analysis using the generated libraries, DPHLv2,15 and library-free approaches.16 (D) Number of peptides detected in more than 10% of samples in total (top) and per sample (bottom). (E) Number of peptides of the generated libraries from subsampling of the DDA-MS EPS-urine cohort. (F) Percent of peptides detected in DIA-MS data using the subsampled spectral libraries.

