. 2024 Apr 2;15(18):6752–6762. doi: 10.1039/d4sc01214c

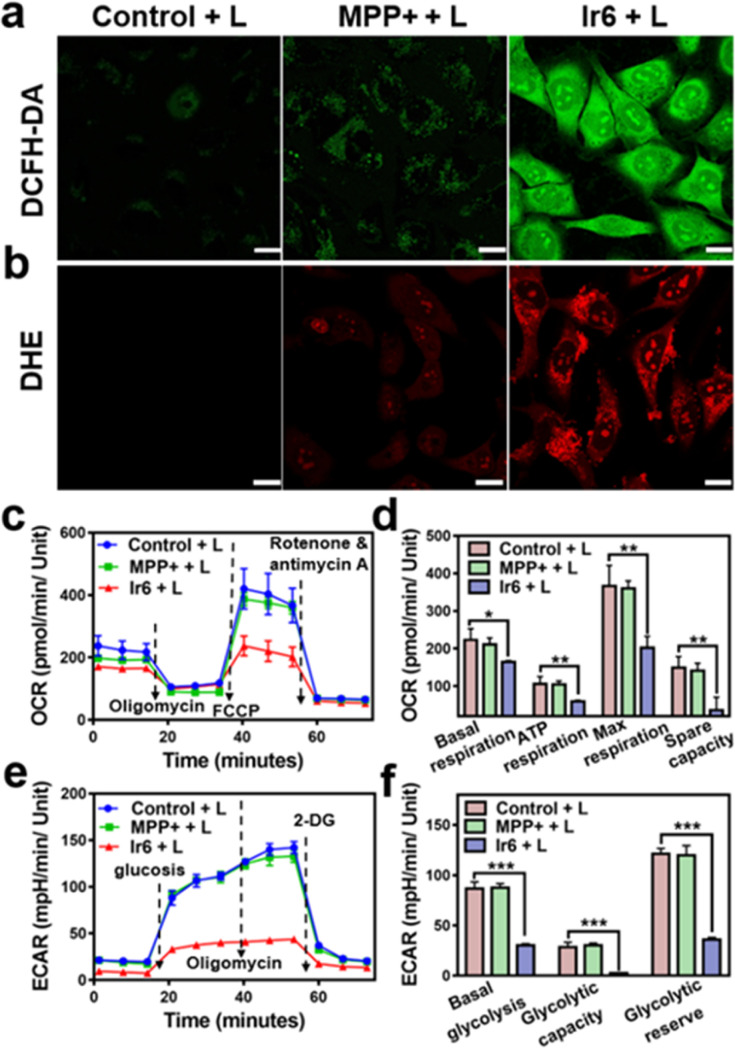
Fig. 2. ROS production, modulation of oxidative phosphorylation, and glycolysis metabolism upon treatment of A375 cells with Ir6 and MPP+ for 6 h. (a) Fluorescence microscopy images of A375 cells incubated with the ROS-specific probe 2,7-dichlorofluorescein diacetate and treated with Ir6 or MPP+ upon light irradiation (L). (b) Fluorescence microscopy images of A375 cells incubated with the ˙O2-specific probe dihydroethidium and treated with Ir6 or MPP+ upon irradiation (L). (c) Kinetic profile and (d) quantification of the oxygen consumption rate (OCR) of A375 cells treated with Ir6 and MPP+ upon light irradiation (L). (e) Kinetic profile and (f) quantification of the extracellular acidification rate (ECAR) profile of A375 cells treated with Ir6 and MPP+ upon irradiation (L). L = two-photon laser irradiation at 720 nm, 40 mW, 120 s, concentration: Ir6 (10 μM), MPP+ (100 μM). Scale bar = 20 μm. n = 3. *p < 0.05, **p < 0.01, ***p < 0.001.

Fig. 2