. 2024 Mar 21;15(18):6738–6751. doi: 10.1039/d4sc00953c

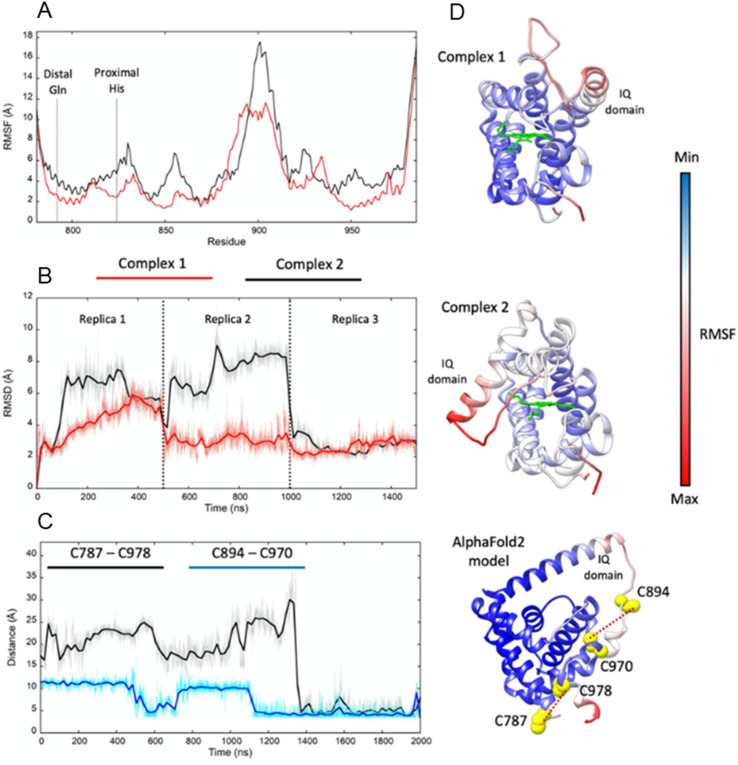
Fig. 4. Molecular dynamics simulations of Adgb-GD complex 1, complex 2, and the AlphaFold 2 model. (A) RMSF comparison between complexes 1 (red) and 2 (black); (B) heme RMSD within complexes 1 and 2 during the MD replicas; (C) distances between pairs of cysteine residues during the MD simulation of the AlphaFold 2 model (C787–C978 in black and C894–C970 in blue); (D) RMSF plotted on complex 1, complex 2, and the AlphaFold 2 model (represented as a ribbon; heme is represented as a green stick); red ribbon colour indicates high structural flexibility; the four cysteine residues of the domain and their distance are shown on the AlphaFold 2 model.

Fig. 4