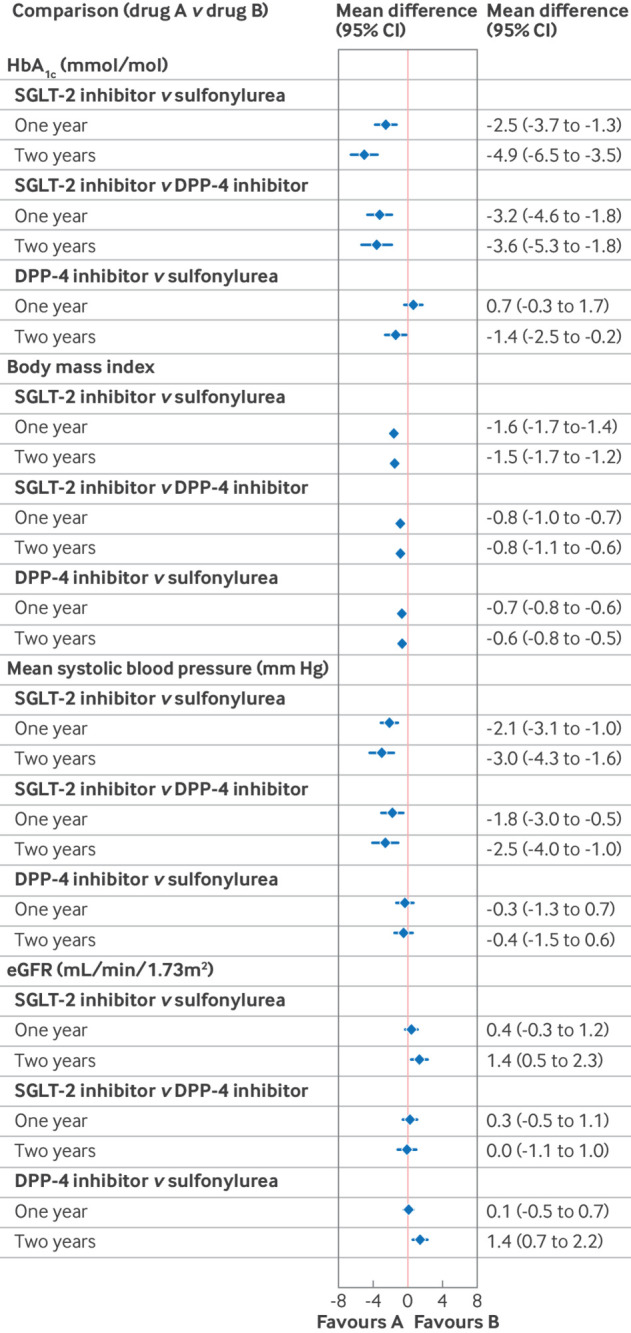
Fig 4.

Forest plot showing differences in the mean change between baseline and one year or two years follow-up in continuous clinical measures comparing second line antidiabetic treatments from the instrumental variable analysis to reduce the risk of confounding, and with multiple imputation to account for missing data, which assumes data are missing at random. . CI=confidence interval; DPP-4=dipeptidyl peptidase-4; eGFR=estimated glomerular filtration rate; HbA1c=glycated haemoglobin A1c; SGLT-2=sodium-glucose cotransporter 2
