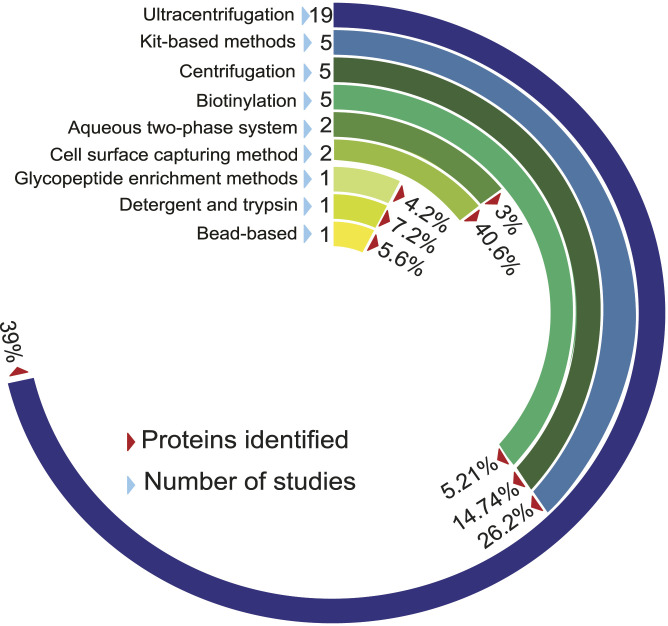
Figure 4. The frequency of different membrane protein enrichment methods and the number of proteins enriched from each method.
The circular bar plot depicts the occurrence of different membrane protein enrichment methods used within the datasets in REMEMProt. In addition, it displays the percentage of the number of studies that used the enrichment methods and the proteins identified. Abbreviations: CSC, cell surface capturing.

