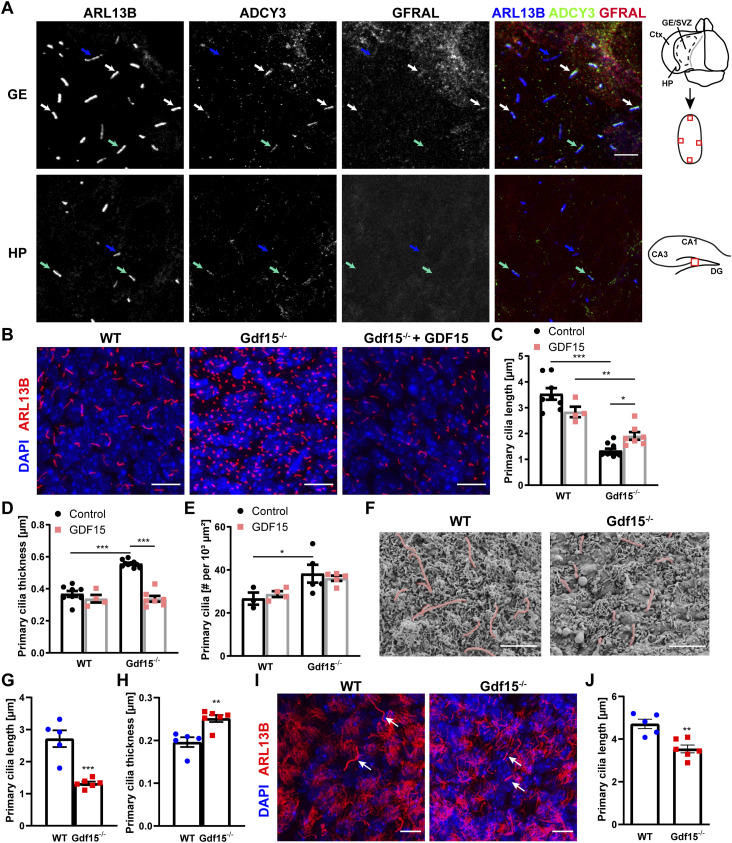
Figure 1. GDF15 affects cilia morphology and number in the lateral periventricular germinal zone.
(A) Representative confocal micrographs of the apical GE and of the prospective dentate gyrus in HP obtained from whole mount preparations of E18 brain tissue upon triple immunostaining with the ciliary marker ARL13B (blue), ADCY3 (green), and GFRAL (red). White arrows point at cilia expressing both ciliary markers and GFRAL, green and blue arrows to cilia expressing both ciliary markers, or ARL13B only, respectively. Scale bar = 5 μm. Cartoons show approximate location of the image (red square) in the GE whole mount or hippocampal section. Ctx = cortex, DG = dentate gyrus. (B, I) Representative confocal micrographs of whole mount preparations of the GE obtained from E18 embryos (B) and adult V-SVZ (I) of the given genotype and treated with 10 ng/ml exogenous GDF15 as indicated. Tissue preparations were immunostained with antibodies to Arl13b (red) to visualize apical cilia and nuclei were counterstained with DAPI (blue). Scale bars = 10 μm. (C, D, E, J) Quantification of primary cilia length (C, J), thickness (D), and number (E) in immunofluorescent stainings of E18 (C, D, E) and adult (J) tissue of dissected from animals of the given genotype and treated as indicated. (F) Representative images of primary cilia (red) at the apical side of the E18 GE of the given genotype upon scanning electron microscopy (ScEM). Scale bars = 2 μm. (F, G, H) Quantitative analysis of cilia length (G) and thickness (H) in SEM samples shown in (F). Bars indicate mean ± SEM. Each data point represents the average of data collected from one individual animal. * indicates significance (*P < 0.05, **P < 0.01, ***P < 0.001) between groups as indicated.

