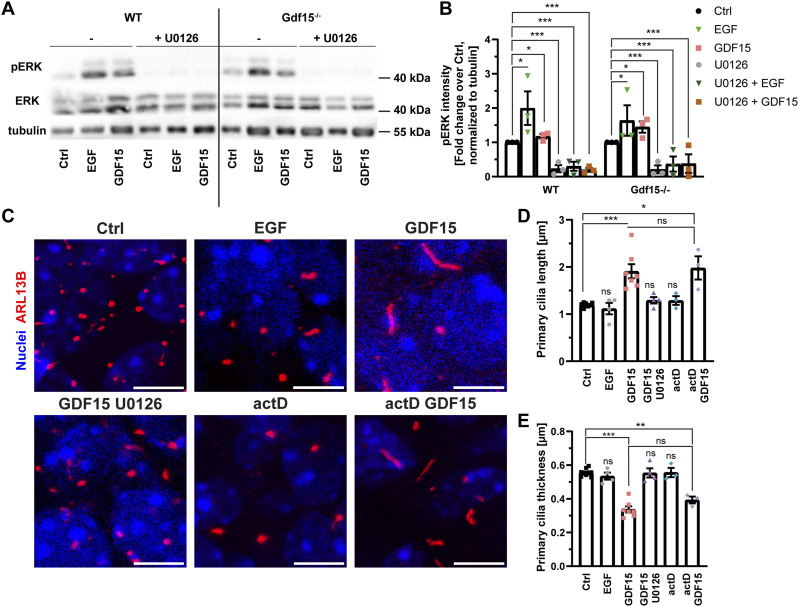
Figure 2. GDF15 effect on primary cilia requires ERK activation and is transcription independent.
(A) Representative images of Western blot analyses of total (ERK) and phosphorylated (pERK) ERK levels in the whole E18 GE of the indicated genotype cultured in the presence or absence of the given compounds for 24 h. (B) Quantification of three independent Western blot experiments showing an increase in pERK upon EGF and GDF15 treatment as well as the reduction of pERK signal by U0126 regardless of genotype and stimulation. pERK levels are shown as fold change over Ctrl, normalized to tubulin as loading control. (C) Representative confocal micrographs of primary cilia at the apical side of whole mount preparations of the Gdf15−/− E18 GE upon exposure to the indicated treatments for 24 h. Thereafter, the tissue was processed for immunostaining with ARL13B antibodies (red) and DAPI (blue) nuclear counterstaining. Scale bars = 5 μm. (C, D, E) Quantification of the effect of the treatments on length (C) and thickness (D) of primary cilia. Bars indicate mean ± SEM. Each data point represents the average of data collected from one individual animal. * indicates significance (*P < 0.05, **P < 0.01, ***P < 0.001) as indicated. Ns, not significant.

