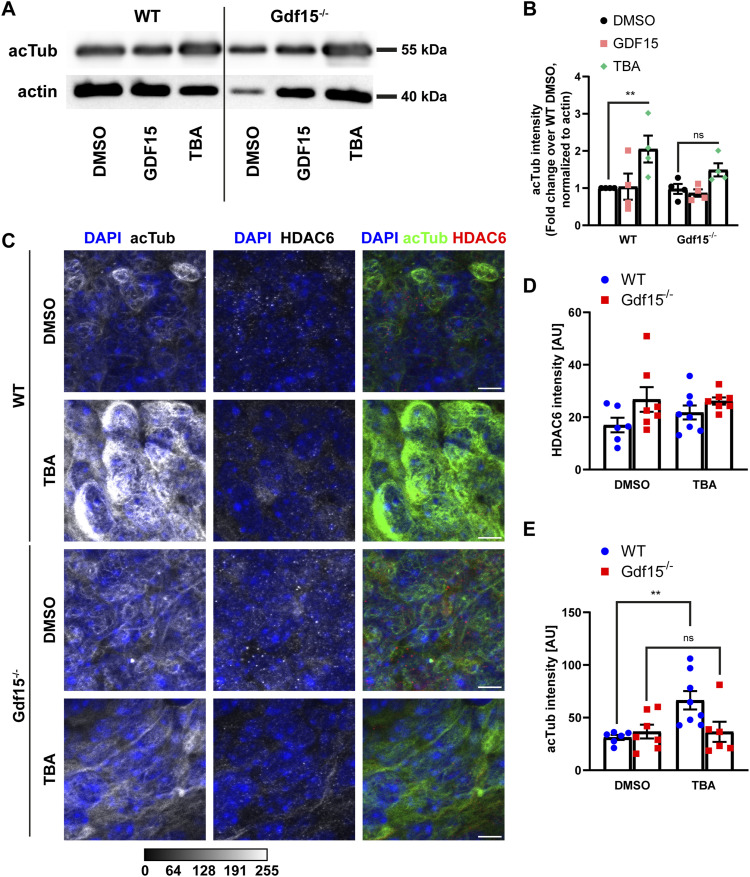
Figure 5. GDF15 modulates HDAC6 activity.
(A) Western blot for acTub in the whole E18 GE of the indicated genotype incubated in the presence of the given compounds for 24 h. Actin was used as loading control. TBA, tubastatin A. (A, B) Quantification of acetylated tubulin (acTub) intensity in (A), normalized to actin. Each data point represents an independent sample from a different animal. (C) Representative confocal micrographs of the apical side of whole mount preparations of the E18 GE of the given genotype and upon exposure to the indicated compounds for 24 h. Thereafter the tissue was processed for immunostaining with antibodies to acTub (green), HDAC6 (red), and DAPI nuclear counterstaining (blue). Scale bars = 10 μm. (D, E) Quantification of the effect of the different treatments on HDAC6 (D) and acTub (E) fluorescence levels. Each data point represents the average of data collected from one individual animal. Bars indicate mean ± SEM. * indicates significance (**P < 0.01) as indicated. Ns, not significant.

