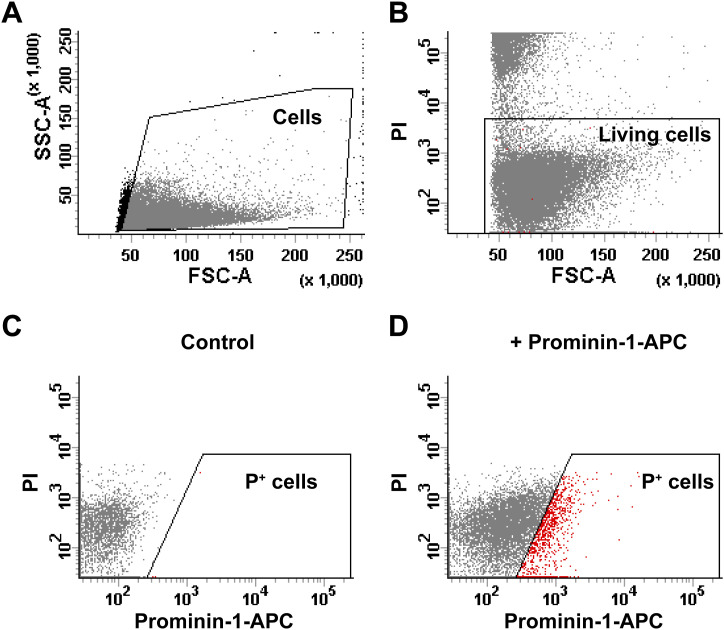
Figure S4. Gating of cells for FACS analysis.
(A) Gate for particles with cell size plotted in forward and side scatter channels. (B) Gate for living cells (propidium iodide negative, PI−) plotted in PI and FSC channels. Cells above the gate (PI+) are considered dead. (C, D) Gate for Prominin-1+ (P+) cells, using cells without (C) and with Prominin-1-APC antibody (D), plotted on PI and APC channels. All graphs show cells dissociated from a WT E18 GE.

