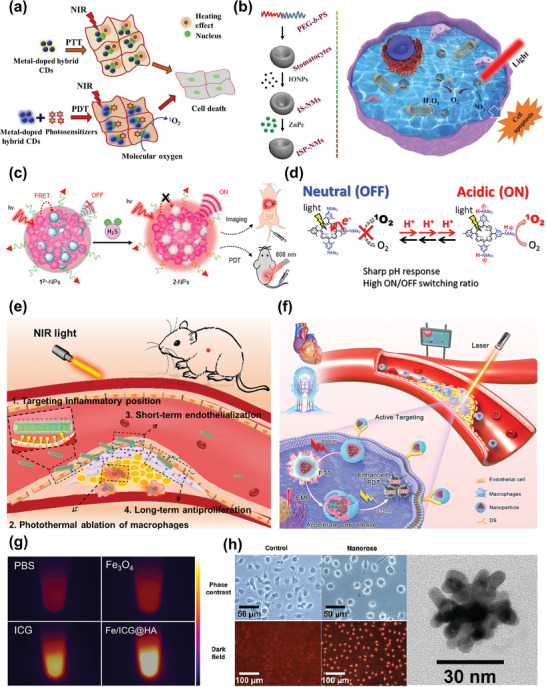
Figure 6.

a) Schematic illustration of phototherapy. Reproduced with permission.[ 106 ] Copyright 2020, Elsevier B.V. b) Schematic diagram of cell death by PDT. Reproduced with permission.[ 111 ] Copyright 2020, Elsevier B.V. c) Activatable photosensitization responds to H2S. Reproduced with permission.[ 123 ] Copyright 2018, American Chemical Society. d) Activatable photosensitization responds to pH change. Reproduced with permission.[ 124 ] Copyright 2016, American Chemical Society. e) Schematic illustration of PTT in the treatment of atherosclerosis. Reproduced with permission.[ 125 ] Copyright 2021, American Chemical Society. f) Schematic illustration of sequential photothermal/photodynamic ablation for activated macrophages. Reproduced with permission.[ 126 ] Copyright 2021, American Chemical Society. g) Near‐infrared thermal imaging images of PBS, ICG, Fe3O4, and Fe/ICG@HA after irradiation with an 808 nm laser. Reproduced with permission.[ 127 ] Copyright 2022, American Chemical Society. h) Small multifunctional nanoclusters and their capability of PTT. Reproduced with permission.[ 64 ] Copyright 2009, American Chemical Society.
