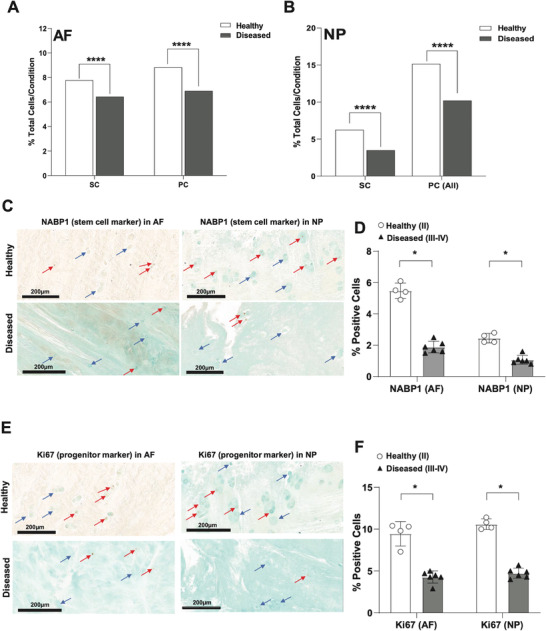
Figure 3.

Depletion of immature subsets in diseased AF and NP. A,B) Quantification of stem cell (SC) and progenitor cell (PC) subsets in healthy versus diseased AF (A) and NP (B). Data are shown as percentage of total cells for each condition in each tissue type. ****p<0.0001 by comparison of proportions tests. Healthy = grade II; Diseased = grade II‐III, grade III and grade III‐IV. C–F) IHC for NABP1 (C,D) and MKI67 (E,F) was performed on healthy (grade II, n = 4) and diseased (grade III‐IV, n = 6) AF and NP tissues. Counterstaining was performed using methyl green to calculate percentages of positive cells verses total cell numbers. Red arrows indicate examples for positive cells and blue arrows show negative cells. Scale bars indicate 200 µm. Quantifications of cells positive for NABP1 (D) or MKI67 (F) in healthy (n = 4) versus diseased (n = 6) AF (left) and NP (right) are shown. Two‐tailed unpaired Student's t‐test were used to establish statistical significance. Data are expressed as means ±SD (standard deviation).*p<0.05.
