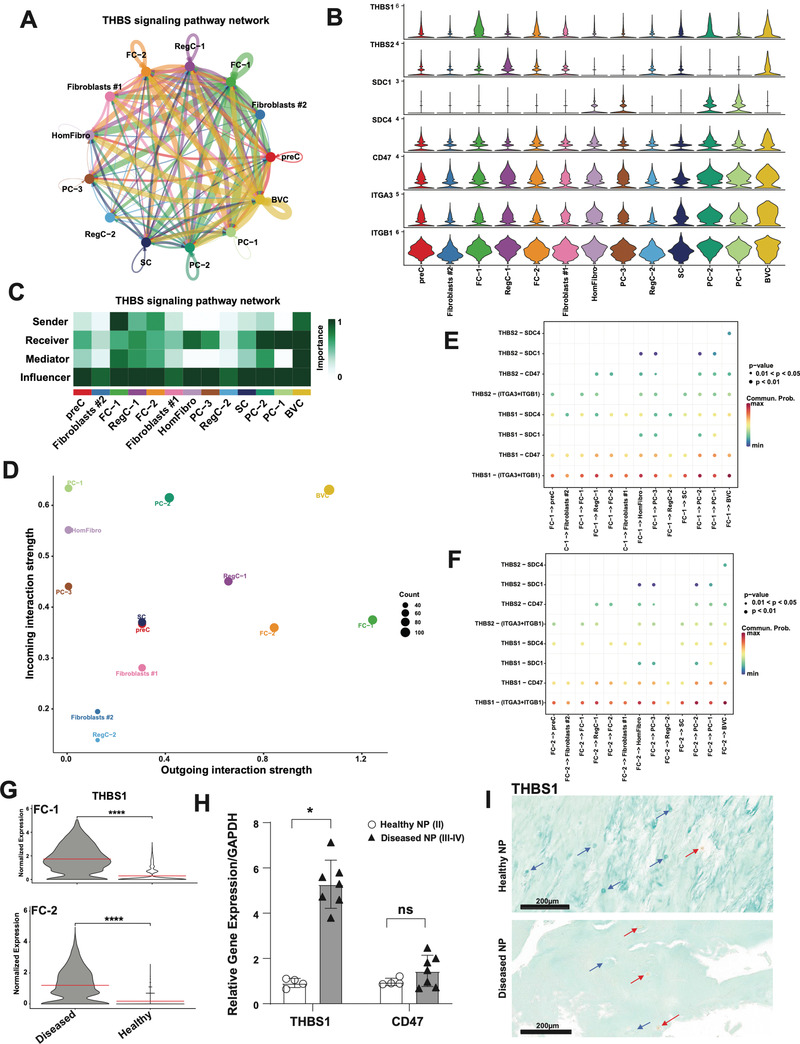
Figure 5.

The expanded fibrotic clusters are critical regulators of THBS signaling in NP. A,C) Circle plot showing direction (A) and heat map (C) showing role importance in the four CellChat‐defined centrality measures in the THBS signaling pathway in all clusters in NP. B) Genes involved in THBS signaling network and their relative expression levels in each NP cluster. D) Overall outgoing and incoming signal strength of each cluster in the THBS signaling network visualized in a scatter plot. E,F) Significance of each ligand‐receptor (L‐R) signaling interaction comprising “THBS” signaling network in NP. FC‐1 (E) and FC‐2 (F) were set as the sources of the signal. G) THBS1 is DE in diseased NP compared to healthy in FC‐1 (top) and FC‐2 (bottom). H) qPCR showing THBS1 and CD47 mRNA abundance in healthy (grade II, n = 4) versus diseased (grade III‐IV, n = 7) NP. Data are relative to GAPDH. Two‐tailed unpaired Student's t‐test were used to establish statistical significance. Data are expressed as means ±SD (standard deviation). *p <0.05. I) IHC for THBS1 and staining was performed on healthy (grade II, n = 4) and diseased (grade III‐IV, n = 6) NP tissues. Counterstaining was performed using methyl green to calculate percentages of positive cells verses total cell numbers. Red arrows indicate examples for positive cells and blue arrows show negative cells. Scale bars indicate 200 µm.
