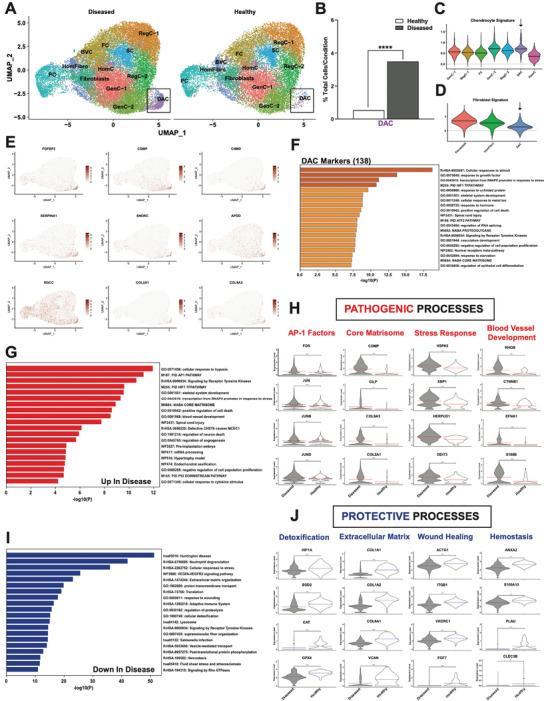
Figure 7.

Identification of an expanded, disease‐associated chondrocyte population in AF. A) Visualization of clustering by split UMAP plot of healthy (n = 3) versus diseased (n = 10) AF samples. The disease‐associated chondrocyte (DAC) subset is shown in black boxes. B) Quantification of the DAC subset in healthy versus diseased AF. Data are shown as percentage of total cells for each condition. ****p<0.0001 by comparison of proportions tests. Healthy = grade II; Diseased = grade II‐III, grade III and grade III‐IV. (C, D) Lists of genes composing individual cluster signatures were established based on previously published literature (Table S2, Supporting Information). The Seurat command AddModuleScore was used to add a signature score to each individual cell in the integrated Seurat object based on mean expression of the genes in the signature lists. These scores were then visualized in violin plots split by cluster. Chondrocyte C) and fibroblast D) signatures are visualized for respective AF clusters. E) UMAPs showing SCT normalized counts of top markers for the DAC: FGFBP2, COMP, CNMD, SERPINA1, SNORC, APOD, RGCC, COL2A1 and COL9A3. F) Functional enrichment analysis using Metascape of the 138 significant markers of the DAC. G,I) Metascape analyses of the genes upregulated (G) and downregulated (I) in diseased compared to healthy in the DAC. H,J) Biological processes and DEGs annotated for these processes in upregulated (H) and downregulated (J) in the DAC.
