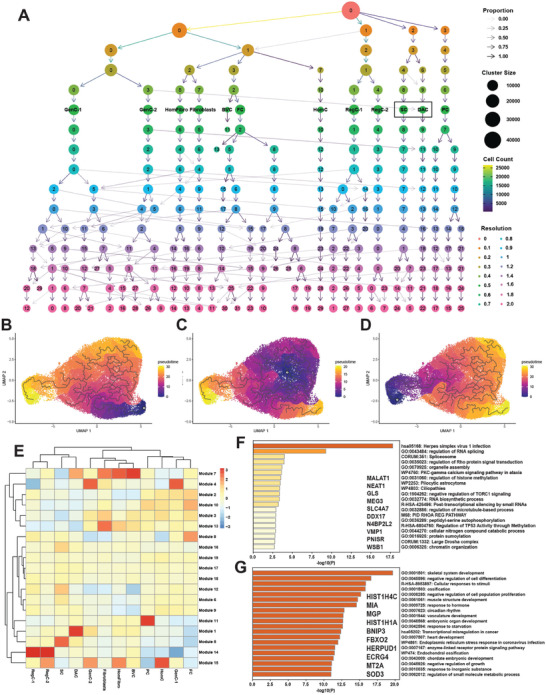
Figure 8.

The DAC is stem cell‐derived. A) Clustree analysis showing clustering patterns from resolutions 0 through 2. Resolution 0.5 was used for all analyses. The stem cell (SC) subset and DAC are marked with black boxes. (B‐D) Monocle3 analysis revealed pseudotime trajectories with the DAC B), stem cell C) and progenitor cell D) populations set as root nodes. All AF cells were involved in reconstructing the trajectories. Root nodes are indicated by white circles. E) Heat map showing aggregated expression of modules containing genes with high variation between clusters in AF. F,G) Metascape analyses of genes in modules 5 (F) and 1 (G). Top 10 genes in each module (ranked by Moran's I) are shown.
