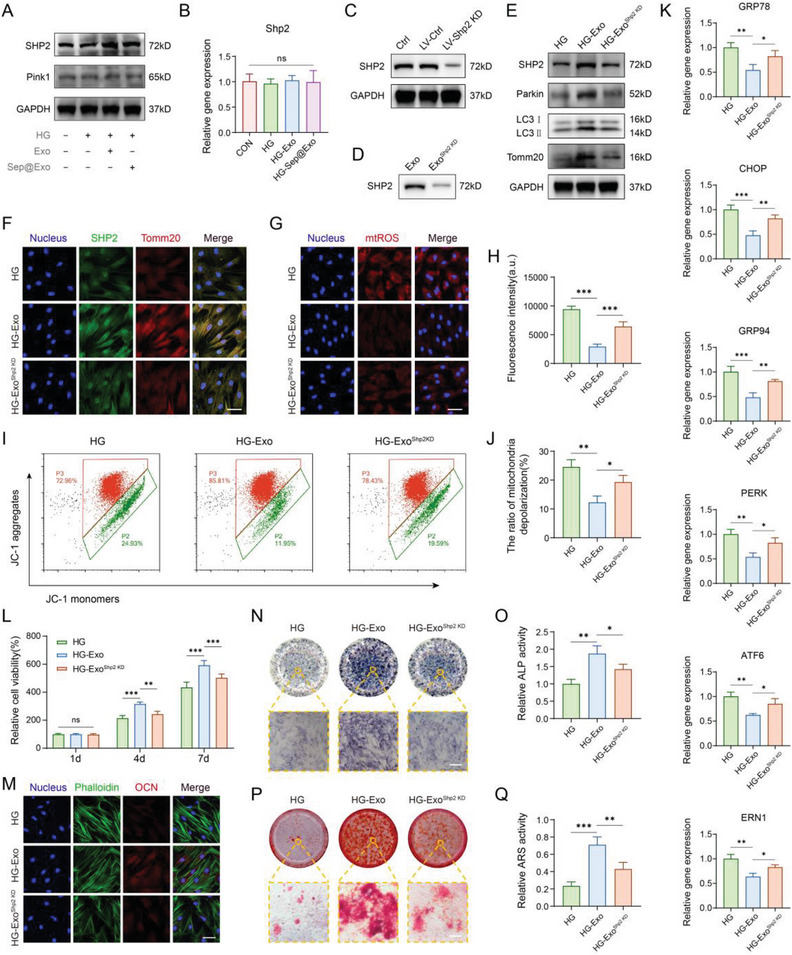
Figure 5.

A) The expression of Pink1 and SHP2 detected by Western blot. B) The mRNA level of Shp2 detected by RT‐PCR (n = 3). C) Western blot showed that LV‐Shp2 KD effectively inhibited SHP2 expression in MSCs. D) The level of SHP2 in exosomes derived from LV‐Shp2 KD‐treated MSCs was markedly reduced. E) The expression of SHP2, Parkin, LC3 I/II, and Tomm20 was detected by Western blot. F) Co‐immunofluorescence staining of SHP2 and Tomm20 (n = 3). Scale bar: 50 µm. G) and H) MitoSOX staining for observing mitochondrial ROS (n = 5). Scale bar: 50 µm. I) and J) JC‐1‐mitochondrial membrane potential assay detected by flow cytometry (n = 3). K) Expression of ER dysfunction‐related genes (n = 3). L) CCK‐8 cell viability assay (n = 3). M) Immuno‐fluorescence staining of OCN. Scale bar: 50 µm. N) ALP staining assay (n = 3). Scale bar: 100 µm. O) ALP activity analysis (n = 3). P) ARS staining assay (n = 3). Scale bar: 100 µm. Q) ARS quantitative analysis (n = 3).
