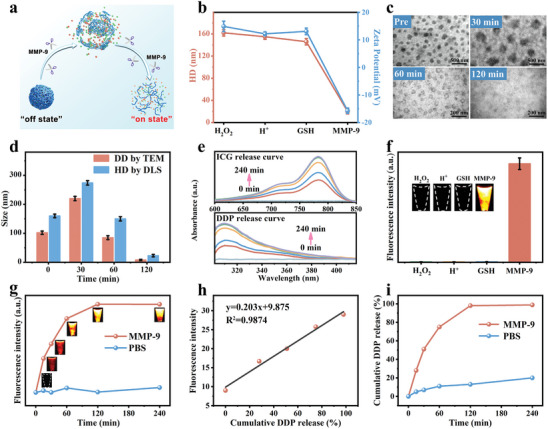
Figure 2.

Evaluation of ICG and DDP release from IRnR‐40 in vitro. a) Schematic degradation process of IRnR‐40. b) The HD and zeta potential changes of IRnR‐40 under different conditions. c) Morphological changes and d) size changes of IRnR‐40 after incubation with MMP‐9 for 0, 30, 60, and 120 min at 37 °C. DD: dehydrated diameter. e) UV–vis absorption of released ICG and DDP from IRnR‐40 after incubation with MMP‐9 for 0, 15, 30, 60, 120, and 240 min at 37 °C. f) NIR‐II FL response property of IRnR‐40 toward various stimuli. g) NIR‐II FL intensity and images of IRnR‐40 in the presence and absence of MMP‐9 at different time points. h) The linear relationship between the cumulatively released DDP and the fluorescence intensity of IRnR‐40 in the presence of MMP‐9. i) Time‐dependent profiles of the cumulative release of Pt in the presence and absence of MMP‐9 by ICP‐OES analysis. Mean ± SD (n = 3).
