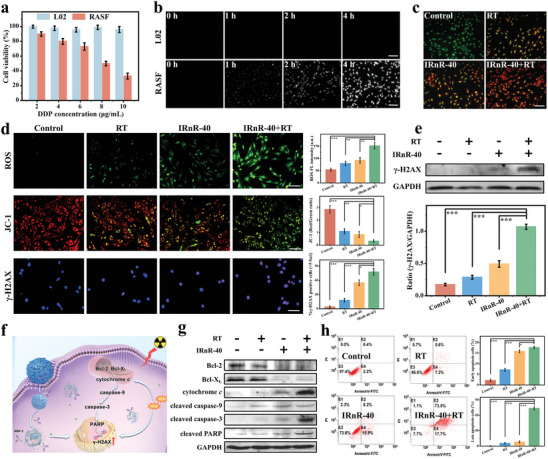
Figure 3.

Therapeutic efficacy of IRnR‐40 in vitro. a) Cell viability of L02 and RASF cells treated with IRnR‐40 at different concentrations for 24 h. b) Microscopic NIR‐II FL images of L02 and RASF cells treated with IRnR‐40 for 0, 1, 2, and 4 h. Scale bar: 100 µm. c) The morphological study of cell apoptosis using AO/EB staining. Scale bar: 100 µm. d) The fluorescence images of intracellular total ROS obtained by DCFH‐DA staining, mitochondrial membrane potential (MMP) by JC‐1 staining, and DSBs by γ‐H2AX immunofluorescence following various treatments. Scale bar: 100 µm. Quantitation of ROS, JC‐1 aggregate (red)/JC‐1 monomer (green) fluorescence intensity, and the percentage of cells with >5 γ‐H2AX‐labeled foci. e) The level of γ‐H2AX protein expression in RASF cells assessed by western blot assay. The gray density scanning analysis of γ‐H2AX protein. f) Schematic illustration of RASF cells treated with IRnR‐40 plus RT and the related apoptosis pathway. g) Western blot analysis of the proteins involved in apoptosis in RASF cells. h) Flow cytometry detection of apoptotic cells and the proportion of early and late apoptosis cells. Mean ± SD (n = 3). * p < 0.05, ** p < 0.01, *** p < 0.001. Student's t‐test.
